
Figure 5.
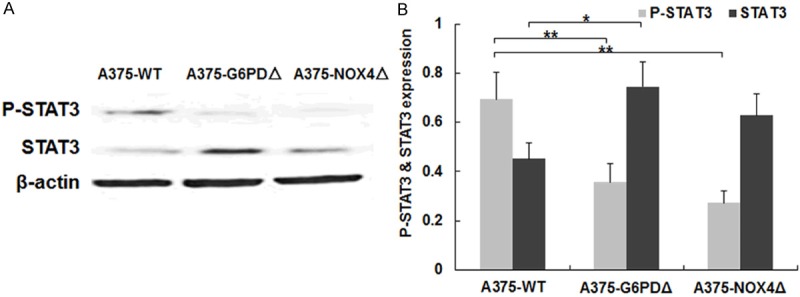
Levels of STAT3 and phosphorylated STAT3 in A375 derived cell lines. A. Levels of the indicated proteins were determined by Western blotting of cell lysate from the indicated cell lines. β-actin signals are shown for reference. B. Quantification of STAT3 and phospho-STAT3 levels in the indicated cell lines. The graph represents results from three independent experiments. *P < 0.05, **P < 0.01.