
Figure 6.
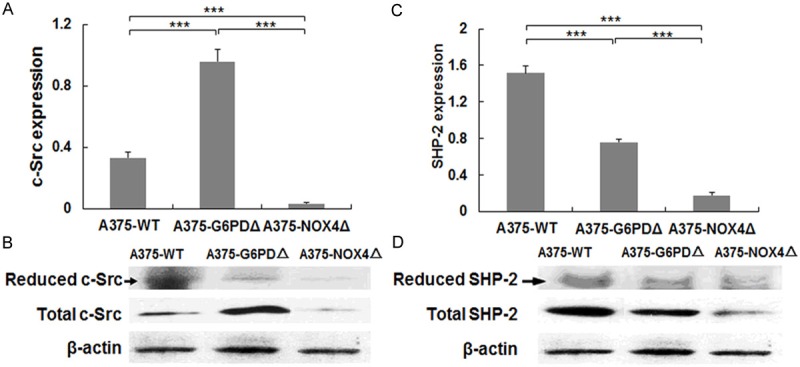
Levels of c-Src and SHP-2 in A375 cells. A, C. The levels of reduced c-Src and SHP-2 and total c-Src and SHP-2 protein expression in the indicated cell lines were determined by immunoblotting. The signals for β-actin are shown for reference. B, D, Quantification of the blots in A and C. Bar graphs show averages of 3 independent experiments with standard error bars. ***P < 0.001.