
Figure 1.
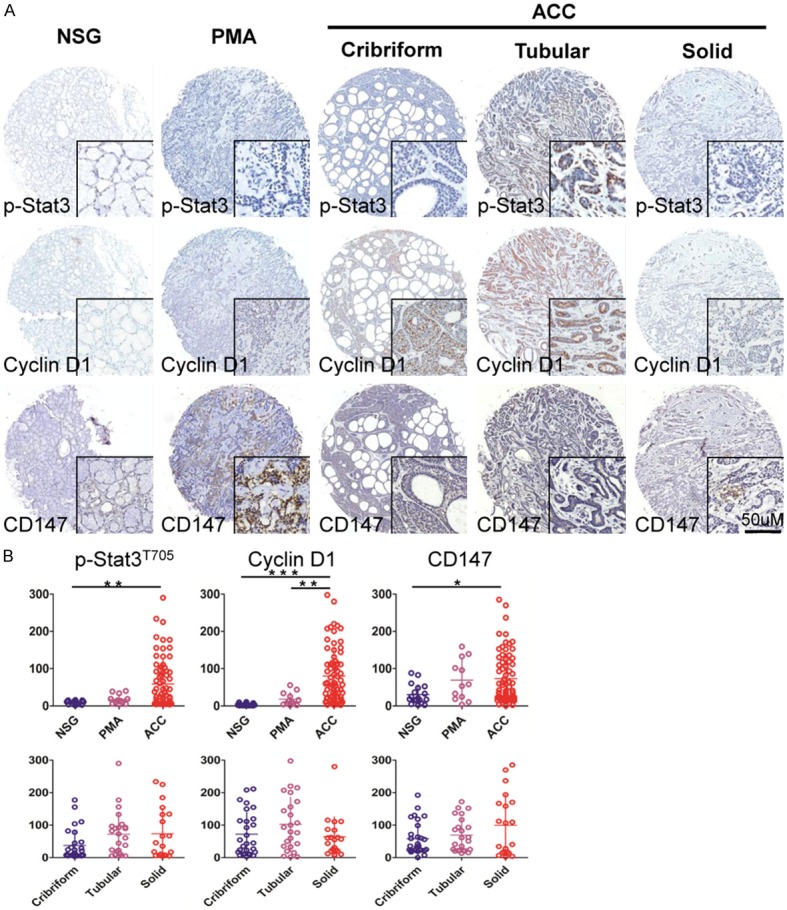
Analysis of tissue microarray cores for immunohistochemistry. A: Representative images from immunohistochemical staining of p-STAT3 nuclear expression (upper), Cyclin D1 nuclear expression (middle), CD147 cytoplasmic expression (lower) in human normal salivary gland (NSG), polymorphism adenoma (PMA) and cribriform, tubular or solid type adenoid cystic carcinoma (AdCC). Scale bar=50 μm. B: Quantification of p-STAT3, Cyclin D1 and CD147 expression levels in human NSG, PMA and AdCC tissue using AperioScanscope scanner and software. Data were analyzed by GraphPad Prism 5 software. (Mean ± SEM; *, p<0.05; **, p<0.01; ***, p<0.001).