
Figure 4.
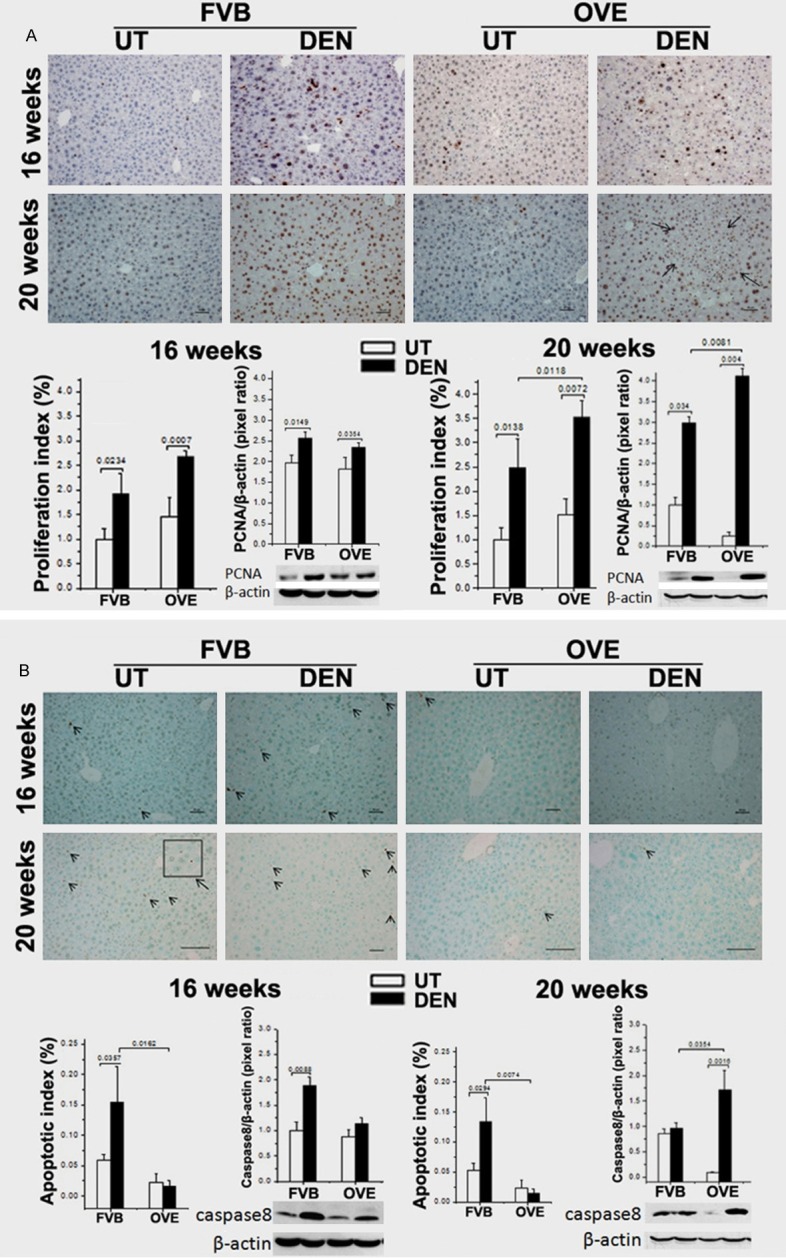
A. Upper, representative images of proliferation by PCNA staining in all 4 groups. Lower, the proliferation index by image-analysis of the positive PCNA cells and the PCNA protein levels in liver tissue by Western blot analysis. Arrow: HCC foci. B. Upper, representative images of apoptosis by TUNEL staining in all 4 groups. Lower, the apoptotic index by image-analysis of the positive apoptosis cells. The protein levels of caspase-8, in liver tissues by Western blot analysis. Arrow head: positive TUNEL staining cells.