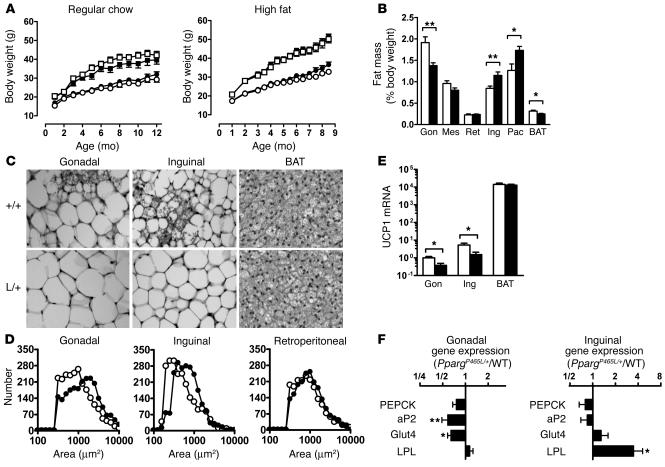
Figure 2.
Altered adipose tissue distribution in PpargP465L/+ mice. (A) Body weights of male mice (open squares, wild-type, n = 9–10; filled squares, PpargP465L/+, n = 9–10) and female mice (open circles, wild-type, n = 7–9; filled circles, PpargP465L/+, n = 8) fed regular chow (left panel) or a high-fat diet (right panel). (B) Adipose tissue mass in 10-week-old female wild-type (white bars) and PpargP465L/+ (black bars) mice fed regular chow. Data are expressed as percent body weights. Gon, Mes, Ret, Ing, and Pec represent gonadal, mesenteric, retroperitoneal, inguinal, and pectoral white adipose tissue, respectively; BAT indicates interscapular BAT. *P < 0.05 and **P < 0.01, compared with wild-type littermates. (C) Morphology of gonadal and inguinal white adipose and brown adipose tissues from 10-week-old female mice fed regular chow. +/+, wild-type; L/+, PpargP465L/+. (D) Distribution of cell size in gonadal (left panel), inguinal (middle panel), and retroperitoneal (right panel) adipose tissues. Open circles, wild-type; filled circles, PpargP465L/+. (E) UCP1 mRNA relative to the level of gonadal adipose tissue from wild-type mice. *P < 0.05 between PpargP465L/+ and wild-type littermates (n = 16 each). The y axis is in a log scale. (F) Relative ratio of mRNA for PPARg target genes in gonadal and inguinal adipose tissues of PpargP465L/+ mice to those of wild-type mice (n = 16 each). *P < 0.05 and **P < 0.005 between PpargP465L/+ and wild-type littermates.

