Figure 4.
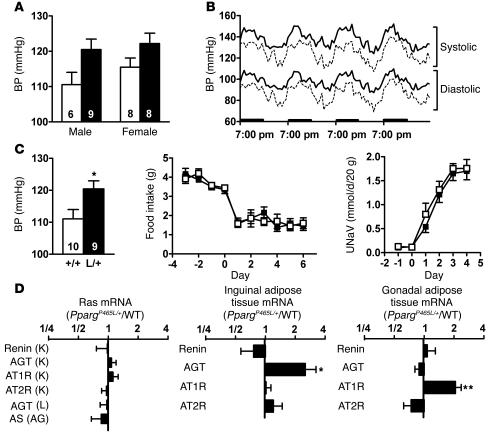
Elevated BP in PpargP465L/+ mice. (A) BP of 14- to 16-week-old wild-type (white bars) and PpargP465L/+ (black bars) mice by tail-cuff measurement. Numbers of mice are inside bars. P < 0.01 for genotype effect by ANOVA. (B) Four-day telemetric recordings of systolic and diastolic BP in 24-week-old female mice. Results are expressed as mean of four wild-type (dashed lines) and four PpargP465L/+ (solid lines) mice averaged with 12 values each hour. Bolded bars on the x axis represent the dark cycles. (C) Responses to changes in dietary salt intake. BP of 14- to 16-week-old male wild-type (white bar) and PpargP465L/+ (black bar) mice fed a high-salt diet for 4 weeks (left panel). Numbers inside bars indicate sample size. *P < 0.05. Changes in daily food consumption (middle panel) and urinary sodium excretion (UNaV; right panel) after mice were switched to a high-salt diet at day 0 for 10- to 12-week-old male wild-type (open squares, n = 7) and PpargP465L/+ (filled squares, n = 6) mice. (D) Relative ratio of the expression of RAS genes in PpargP465L/+ mice to those in wild-type mice (n = 16 each). Left panel, organs of major RAS expression: K, kidney; L, liver; AG, adrenal gland. Middle panel, inguinal adipose tissue. Right panel, gonadal adipose tissue. *P < 0.05 and **P < 0.005 between PpargP465L/+ and wild-type mice.

