Figure 1.

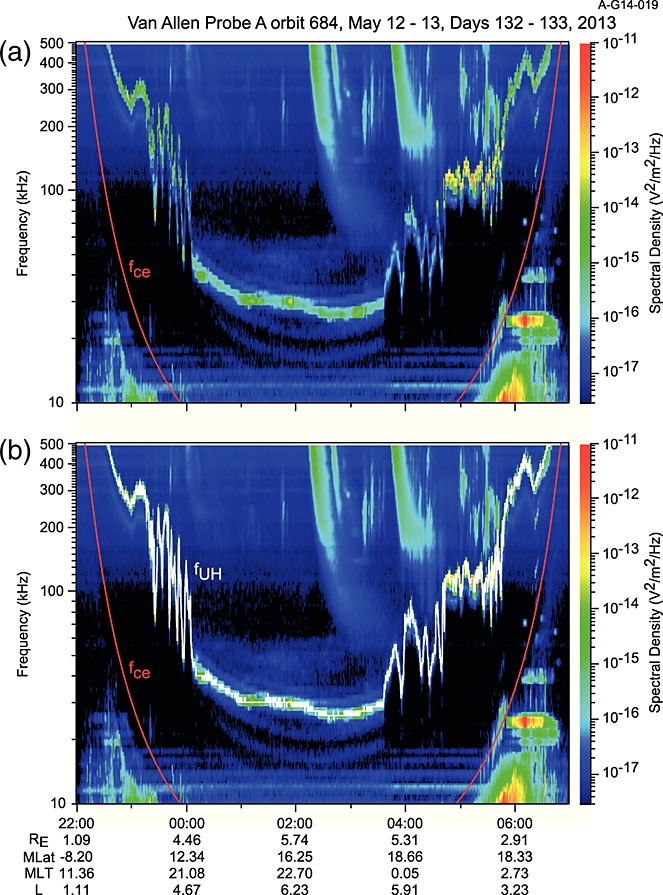
(a) An example spectrogram of Waves HFR data showing the upper hybrid resonance band. (b) In this panel, fuh is highlighted in white. The electron cyclotron frequency is indicated with a red trace.

(a) An example spectrogram of Waves HFR data showing the upper hybrid resonance band. (b) In this panel, fuh is highlighted in white. The electron cyclotron frequency is indicated with a red trace.