Figure 1.

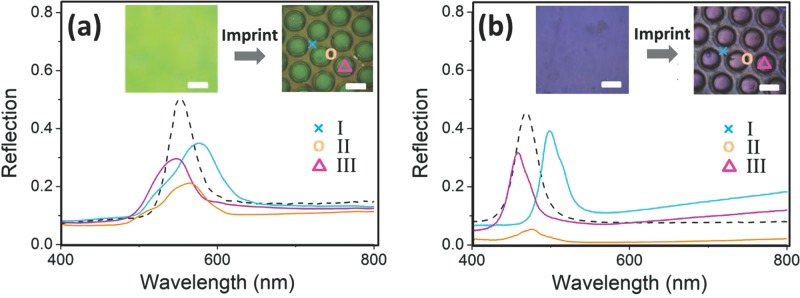
Reflection spectra of POFs before (dashed) and after (solid) the imprinting process. Line colors show marked regions of inset optical images. Scale bars in insets are 100 μm. (a) POF made of PS@PMMA@PEA, (b) POF made of SiO2@PMMA@PEA.

Reflection spectra of POFs before (dashed) and after (solid) the imprinting process. Line colors show marked regions of inset optical images. Scale bars in insets are 100 μm. (a) POF made of PS@PMMA@PEA, (b) POF made of SiO2@PMMA@PEA.