Figure 3.

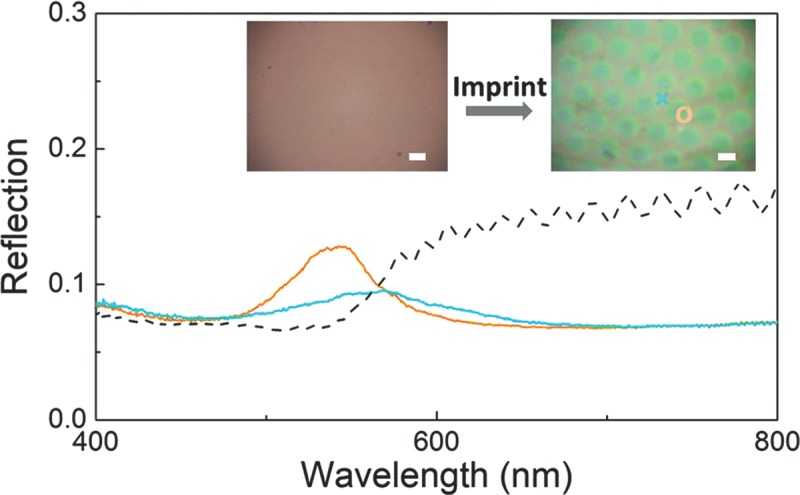
Reflection spectra of unordered (dashed) and imprinted POFs (sheared regions: orange solid line; squeezed regions: blue solid line). Insets show optical images of patterns (spectral measurements at points marked). Scale bar 100 μm.

Reflection spectra of unordered (dashed) and imprinted POFs (sheared regions: orange solid line; squeezed regions: blue solid line). Insets show optical images of patterns (spectral measurements at points marked). Scale bar 100 μm.