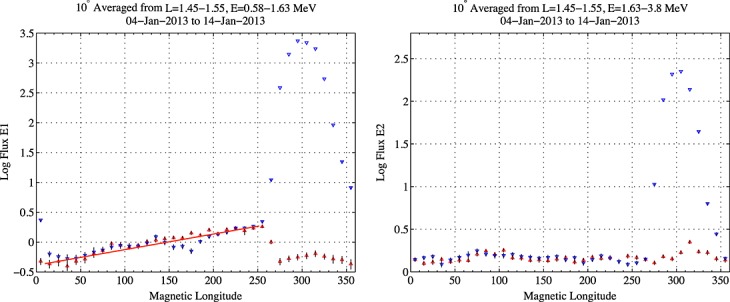
Figure 2.

REPTile measurements around L = 1.7 in the Southern Hemisphere (blue) and Northern Hemisphere (red) versus magnetic longitude for the time period of 4–14 January 2013. The red line on the left figure guides the slope, which suggests a weak pitch angle diffusion as the electrons drift toward the South Atlantic Anomaly region, >250°.
