
Figure 2.
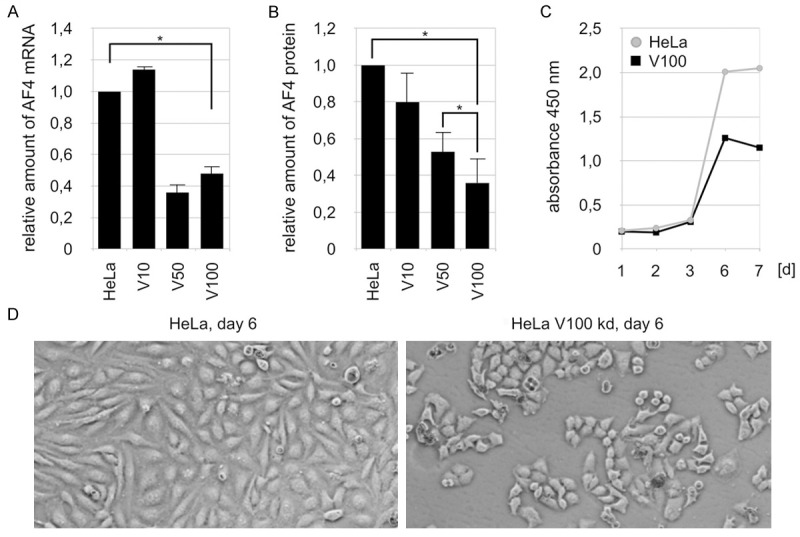
Characterization of the AF4kd V100 stable cell line. A. Results of the AF4-specific ELISA after transduction of HeLa cells with viral particles and establishment of resistance to puromycin. Relative amounts of AF4 protein in regular HeLa cells (100% = 1) and knock-down lines V10, V50 and V100 are depicted [n = 4, +S.E.M., *p < 0.05]. B. Quantitative analysis of relative amounts of AF4 mRNA by qPCR from prepared cDNA of the V10, V50 and V100 infected HeLa cells (100% = 1). Amounts are normalized to Actin [n = 3, +S.E.M., *p < 0.05]. C. CCK-8 proliferation assays of AF4kd V100 cells over a time course of 7 days, compared to non-treated HeLa cells [n = 3, ±S.E.M.]. D. Representative in-vitro microscopy images of AF4kd V100 cells during day 6 of the proliferation assays (magnification 100x, 10 ms. exposure) showing cowered morphology and non-commenced confluence.