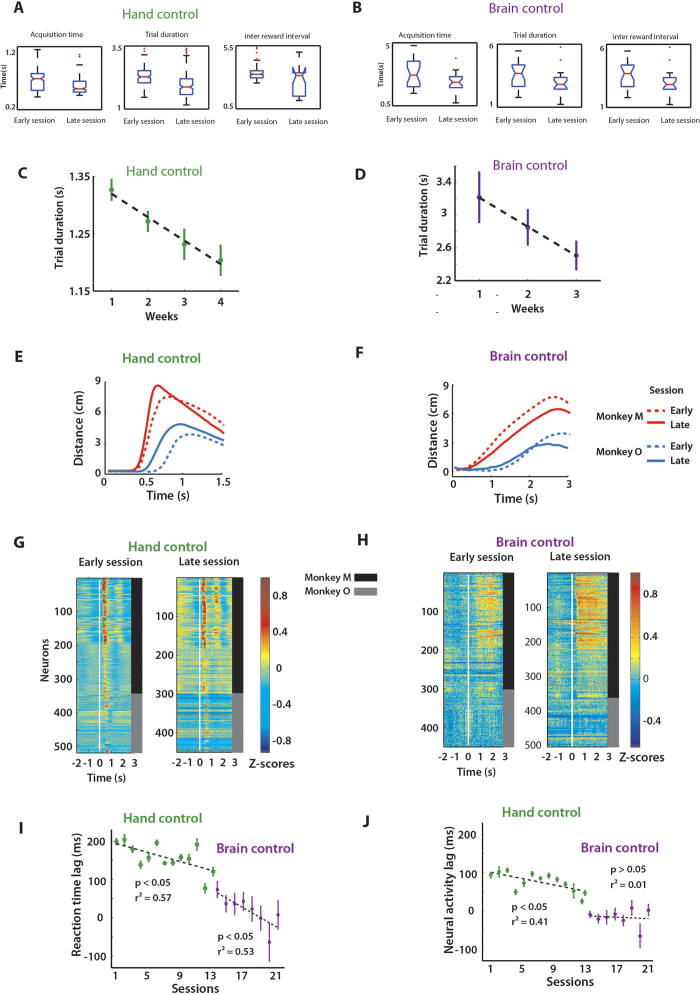
Figure 2. B2 shared control task.
(A,B) Boxplots comparing target acquisition time (left panel), trial duration (centre panel), inter-reward interval (right panel) in hand control (A) and in brain control (B). (C,D) Changes in trial duration with conjoint training across weeks. Mean ± SEM trial duration for each of the four weeks of hand control experiments (C) and three weeks of brain control (D) for dyad M&O. Dashed line shows linear regression fit. Trial duration reduced significantly with improvement in coordination between monkeys. (E,F) Trial-averaged movement profiles from an early session (dashed) and a late session (solid) for monkey M (red) and O (blue) aligned to the time of target onset (time = 0 ms.). Plots are shown up to 1.5 s for hand control (with mean target acquisition time of 0.8 s) and 3 s for brain control (with mean target acquisition time of 2.2 s). The target was located 9 cm from the centre (y-axis). As the dyad trained together over a span of 7 weeks the reaction time lag, the time of movement onset of monkey O relative to monkey M, decreased during both hand control (E) and brain control (F) (G,H) Neural activity PETH from an early session and a late session for hand control (G) and brain control (H) Each row is a single neuron, colour denotes normalized firing amplitude. Monkey M and O neurons marked by black (M) and grey (O) vertical bands. Notice that neuronal modulations are more intense and synchronized across the monkey pair in the later session as compared to the early session. (I) Changes in reaction time lag between monkey M and O across experiments. Lag was derived from peak of cross-correlation of two monkeys’ behavioural traces (E,F) Trends fit with linear regression. As the dyad trained together the reaction time lag reduced to 10 ± 27 ms. (J) Lag in neural activity between two monkeys over the same experiments as in (E) computed again by finding the peak of cross correlogram on each session. As the dyad trained together the reaction time lag reduced to 4.2 ± 5 ms.

