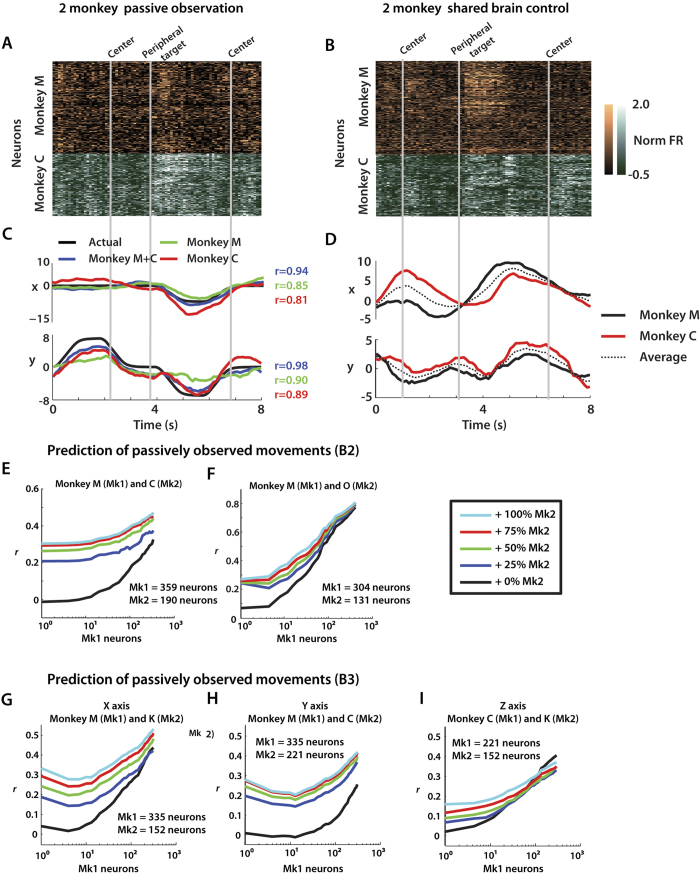
Figure 5. Neuronal representations during B2 and B3 shared control experiments.
Neuronal modulations from monkey M (orange) and C (green) during a 10 second window of passive observation. (A) and brain control (B) Centre and peripheral target onset times are denoted by grey vertical lines. Cortical ensembles in each monkey exhibited clear task-related activity during both passive observation and brain control modes. (C) Passively observed trajectory (black) compared with predicted trajectory using only Monkey M (green), only Monkey C (red), or both (blue) neuronal ensembles. Grey vertical lines from (A) again denote relevant task events. Accuracy of arm movement decoding improved when VLSBA was recorded and combined from multiple brains. (D) Decoded X and Y trajectories from monkey M (black, solid) and monkey C (red), as well as the average of the two (dotted) during 8 second window of brain control experiment. (E,F) Neuron dropping curves (NDC) showing effect of ensemble size of each of the two monkeys on prediction accuracy during B2 passive observation. The number of neurons used from Mk1 marked by x-axis. The percent of Mk2 population used for predictions denoted by colour (see Legend). Accuracy of predictions measured as correlation coefficient r. The decoding accuracy benefited from mixing the contributions from different brains as well as the overall neuronal mass. (G-I) Same NDC analysis as (E,F) except for prediction of X, Y, and Z position during B3 passive observation. Prediction of X (G), Y (H), and Z (I) shown separately. Again (as seen in E-F), the decoding accuracy benefited from mixing the contributions from different brains as well as the overall neuronal mass.

