
Fig. 2.
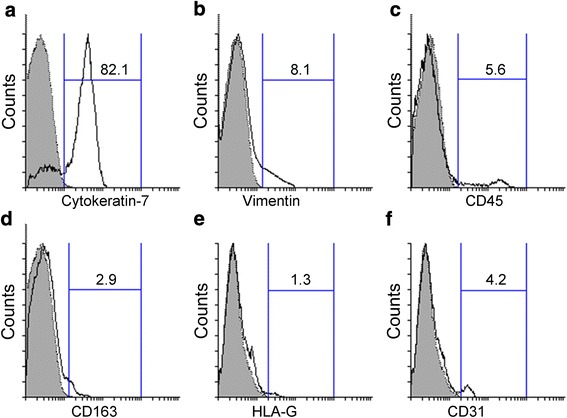
Purity of villous cytotrophoblast cells after Percoll isolation. The expression levels of cytokeratin-7 (a), vimentin (b), CD45 (c), CD163 (d), HLA-G (e) and CD31 (f) in Percoll-isolated cytotrophoblast cells were analyzed using flow cytometry. Gray shaded histogram: isotype-matched negative control. Black line: specific antibody expression. Numbers indicate the percentages of particular antibody positive cells among isolated cells (%). The depicted result is representative of four independent experiments