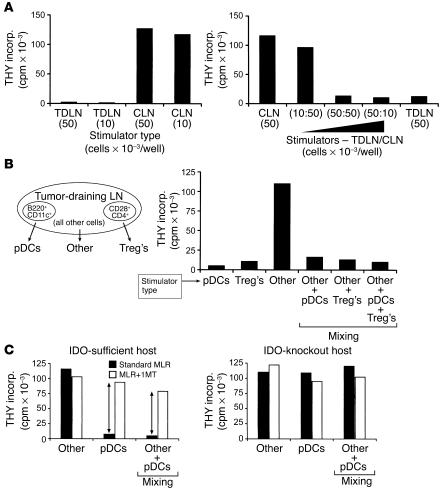
Figure 2.
Suppression of T cell responses by TDLN cells. (A) Cells from TDLNs and contralateral LNs (CLN) were harvested from mice with B78H1–GM-CSF tumors (day 14), and used as stimulators in MLRs (stimulator cell number in parentheses; responder BM3 T cells at 5 × 10⁴ per well). Mixing experiments (right) demonstrated dominant suppression by the TDLN cells. (B) TDLN cells were sorted by four-color flow cytometry into pDCs (<1%), Treg’s (2–3%), and all other cells (95–97%), using the markers shown. Each fraction was used as stimulator cells in MLRs, adding the number of cells that would have been present in 5 × 10⁴ of the original TDLN population (thus, the pDCs were added at approximately 500 cells per well). All MLRs received 5 × 10⁴ BM3 responders. For mixing experiments, the sorted fractions were mixed in the same ratio in which they were present in the original unsorted preparation. (C) Suppression by pDCs is mediated by IDO. TDLN cells were sorted as described for B. The pDCs and “other” fraction were used as stimulators in MLRs (BM3 responders), with and without the IDO inhibitor 1MT. Left: TDLN cells taken from a wild-type (IDO-sufficient) host, showing suppression by pDCs, which was blocked by 1MT (arrows), and dominant suppression with mixing. Right: Tumors were grown in IDO-KO hosts, and the IDO-KO TDLN cells were harvested and assayed as at left. THY incorp., thymidine incorporation.

