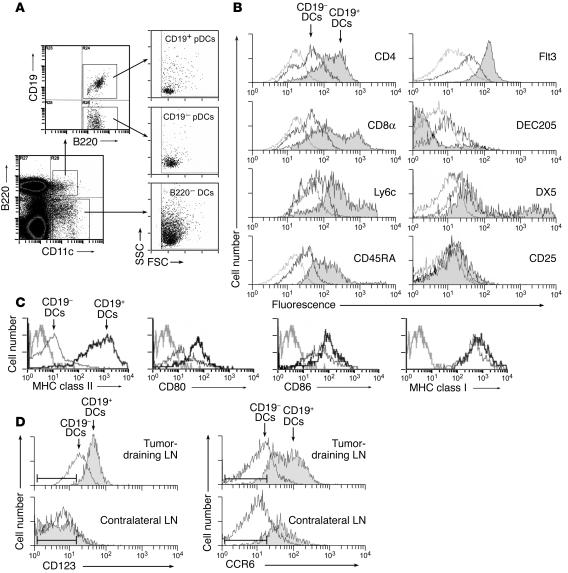
Figure 7.
The CD19+ DC subset displays a phenotype consistent with pDCs. (A) Forward and side-scatter characteristics of B220+ DCs versus B220+ DCs, with the latter further gated into CD19+ and CD19– subsets. (B) TDLNs stained by four-color flow cytometry for CD11c versus CD19 versus the various markers shown. Overlay histograms show the CD19+ (filled trace) and CD19– subsets of CD11c+ cells. Isotype-matched controls (gated on CD11c+ cells) are shown in gray. Each histogram is representative of 4–12 experiments with each marker. (C) TDLN DCs were stained for markers of DC maturity, and analyzed as above. (D) Expression of cell-surface markers CD123 and CCR6 on the CD19+ and CD19– DC subsets. Cells were analyzed from TDLNs and from contralateral LNs of the same animals, as shown. The range for the isotype-matched negative control antibody (± 3 SD) is shown by the bars in each histogram.

