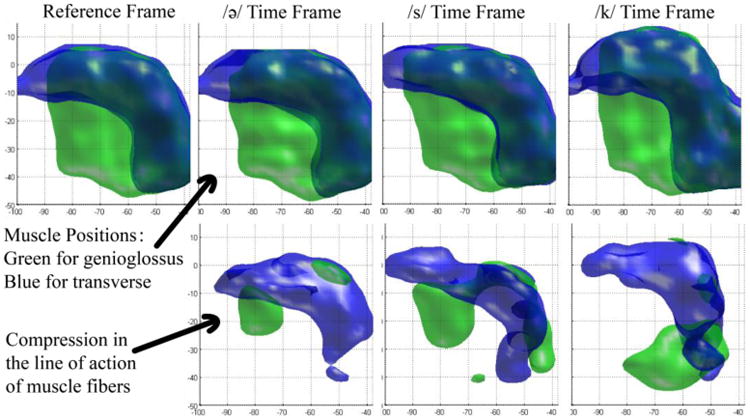
Figure 3.

Strain in the line of action of muscle fibers of the control. The top row is the segmented shape of GG (green) and T (blue) muscles at different time frames. In the bottom row, local compression of genioglossus is shown in green, and compression of transverse is shown in blue for the same time frames.
