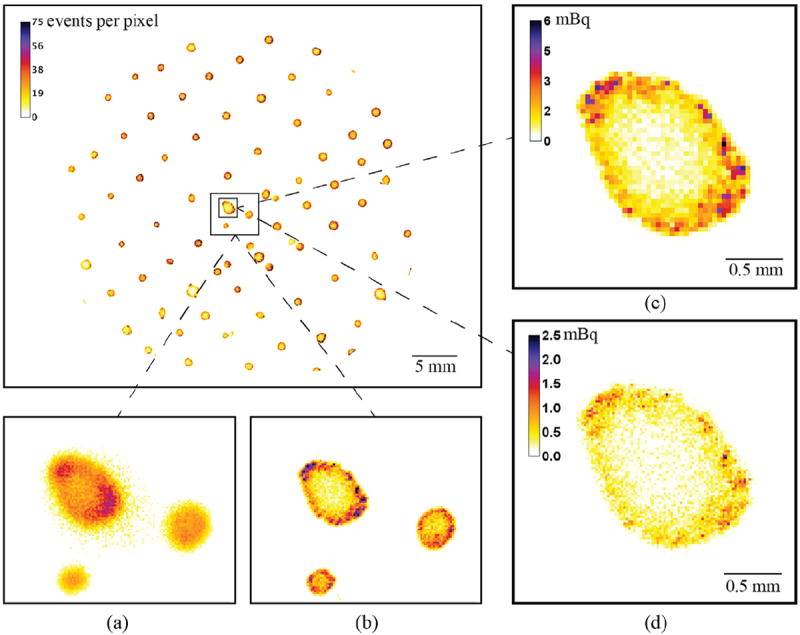
Fig. 8.

Spatial distribution of alpha particles and fission fragments from stippled drops of 252Cf, ~1 Bq per drop. (a) Magnified sub-region of the source that is generated by summing light from each event cluster. Note the induced image blur caused by this method in contrast to identifying and estimating the position of each particle to the nearest pixel (b). (c, d) Activity distribution of a source drop, where the colorbar scale is in units of millibecquerels, with event positions estimated to the nearest pixel (40 × 40 μm2 pixels) (c) and sub-pixel quadrant (d) (20 × 20 μm2 pixels). (For interpretation of the references to color in this figure caption, the reader is referred to the web version of this paper.)
