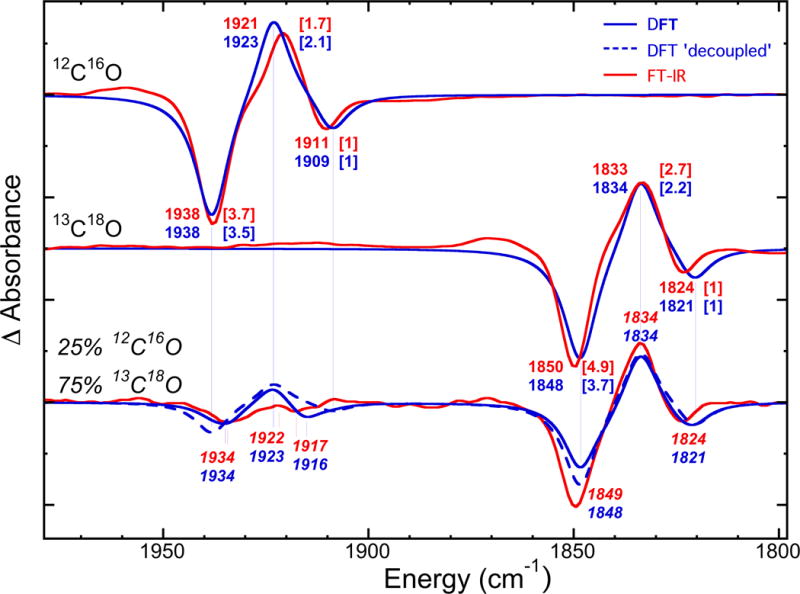
Figure 5.

Overlay of the FT-IR (red) vs. DFT (blue) modelling (blue) of the Hi-3→Lo-3 photolysis difference spectra for pure 12C16O (top) and 13C18O (middle), and the mixed 25% 12C16O / 75% 13C18O (bottom) isotope experiments. The observed FT-IR and calculated DFT frequencies are in cm−1; the wave numbers for the mixed isotope case are in italic for clarity. For pure isotope spectra, the peak intensities are given in square brackets relatively to the lower frequency Hi-3 band. The simulation of the hypothetical ‘decoupled’ mixed isotope spectrum is presented as the broken line; the long vertical lines imply that this spectrum provides no peak shifts with respect to the pure isotope spectra.
