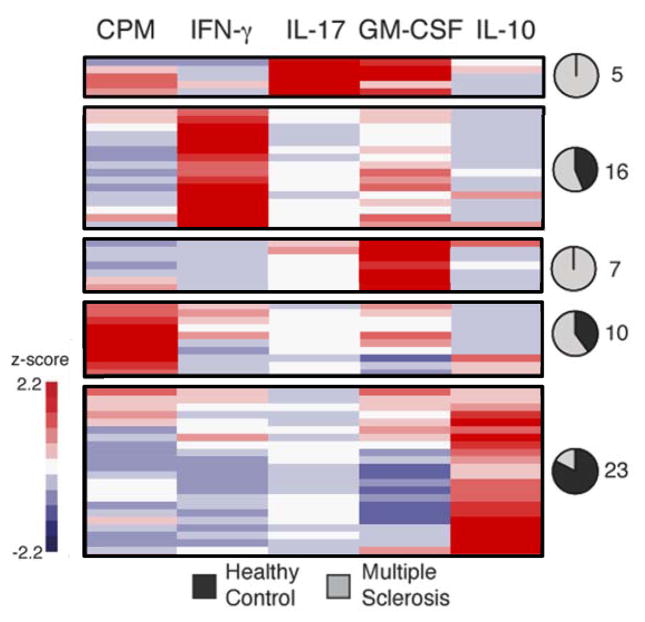
Fig. 3. Single-cell clonal analysis of myelin-reactive CCR6+ memory CD4+ T cells in HLA-DR4+ patients with MS and healthy control subjects.
Tetramer-sorted single cell clones (n = 144) were stimulated with DR4 myelin peptides (MOG97-109 and PLP180-199) to verify the specificity. Heatmap shows functional profiles of individual clones measured on day 5 after stimulation. Data were z-score normalized within a given parameter, and organized by hierarchical clustering. Clusters that separated in the dendrogram by a distance metric of 3 are shown in each box, and pie charts indicate proportion of clones within a given cluster derived from healthy (black) or MS (grey) subjects. The numbers next the pie charts refer to the clones classified into each proportion. Clones that did not respond after re-stimulation (42 healthy control and 41 MS clones) are not shown here, but did cluster together.

