
Figure 4.
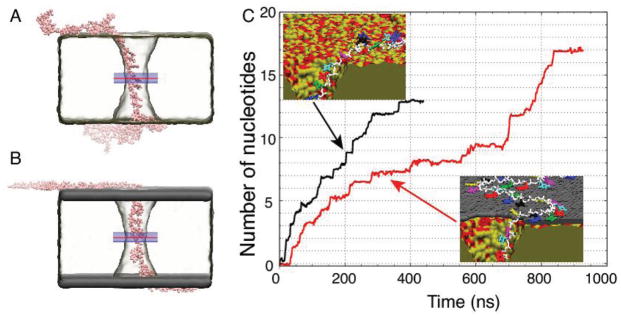
All-atom MD simulations of ssDNA translocation through nanopores. A,B) Representative conformations of a poly(dT)50 strand in MD simulations of nanopore transport through dielectric. A) and grapheme—dielectric–graphene. B) membranes. The minimum diameter of the nanopore in each membrane was 1.7 nm. C) The number of nucleotides transported through the midplane of the membrane by a 500 mV bias versus simulation time. The midplane’s location is indicated by a red line in panels A and B. The average permeation rates are 0.0324 and 0.0195 nucleotides/ns for the dielectric (black trace) and graphene–dielectric–graphene (red trace) membranes, respectively. The insets depict interactions of ssDNA with the surface of the dielectric (top) and graphene–dielectric–graphene (bottom) membranes. The bases do not strongly interact with the surface of silica, but stack strongly to graphene.