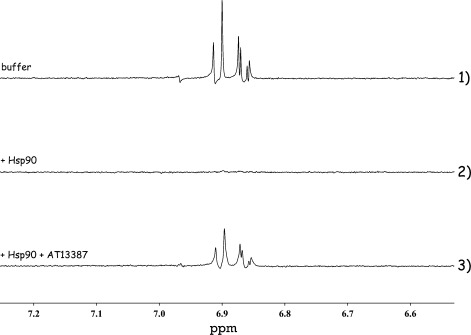
Figure 2.

LLS NMR spectra of ligand II in three different solutions, sustaining the LLS for a delay Δ=2.5 s: 1) 500 μm ligand II in the absence of Hsp90; 2) 500 μm ligand II in the presence of 10 μm Hsp90; 3) 500 μm ligand II in the presence of 10 μm Hsp90 and 10 μm AT13387. In the latter case, ligand II is partly expelled from the ATP binding site of Hsp90 so that its LLS signal is partly restored.
