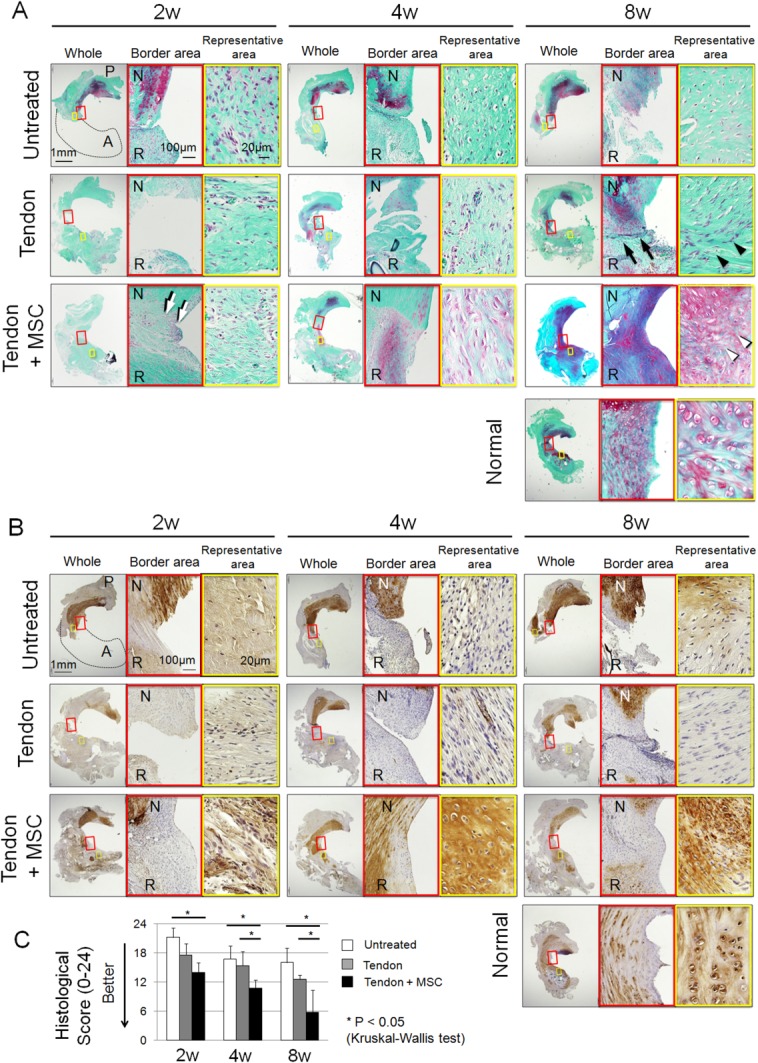
Figure 2.

Histological analyses for regenerated meniscus. (A): Sections stained with safranin-o. The left panels in each time period show the whole medial meniscus. The red square shows border area between the native meniscus and the grafted tendon. The yellow square shows representative area during the regenerating process. One 20-week old normal rat was used as a control. (B): Sections immunostained with type II collagen. The red square shows border area between the native meniscus and the grafted tendon. The yellow square shows representative area during the regenerating process. One 20-week old normal rat was used as a control. (C): Pauli's histological score for regenerated meniscus. Bars show the mean ± SD (n = 5). *, p < 0.05 by Kruskal–Wallis test. Abbreviations: A; anterior, P; posterior, N; native meniscus, R; regenerated meniscus; MSC, mesenchymal stem cell.
