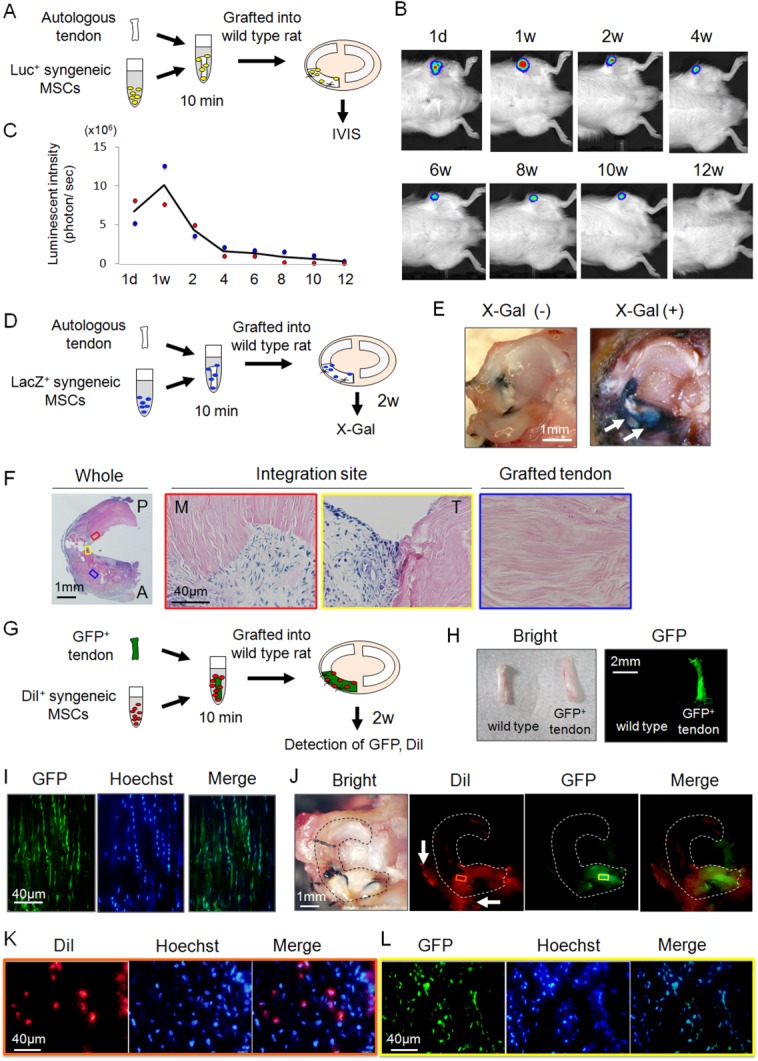
Figure 4.

Detection of transplanted synovial mesenchymal stem cells (MSCs) and grafted tendon. (A): Schematic representation of the bioluminescent in vivo imaging analysis (IVIS). (B): Detection of photons from synovial MSCs derived from a luciferase expressing transgenic rat. (C): Sequential quantification of luminescence intensity. Raw data are plotted and the averaged values are shown as a line (n = 2). (D): Schematic representation of the detection of transplanted MSCs derived from a LacZ expressing transgenic rat (n = 2). (E): Macroscopic features after X-Gal staining for tibial plateau with medial meniscus. White arrows indicate the LacZ positive area. (F): Histological analysis of LacZ positive cells after X-Gal staining. The red and yellow squares show the integration site of native meniscus side and grafted tendon side respectively. The blue square shows the inner part of the grafted tendon. (G): Schematic representation of analyses of regenerated meniscus grafted with green fluorescence protein (GFP+) Achilles tendon with DiI+ MSCs (n = 2). (H): Macroscopic features of GFP+ Achilles tendon. (I): Histology of GFP+ tendon. (J): Macroscopic images of regenerated meniscus. The red or yellow squares show the site of histological analysis for DiI or GFP respectively. White arrows indicate the synovium which covered the grafted tendon. (K): Histological analysis of DiI+ MSCs in the regenerated meniscus. (L): Histological analysis of GFP+ tendon cells in the regenerated meniscus. Abbreviations: GFP, green fluorescence protein; IVIS, in vivo imaging analysis; MSC, mesenchymal stem cell.
