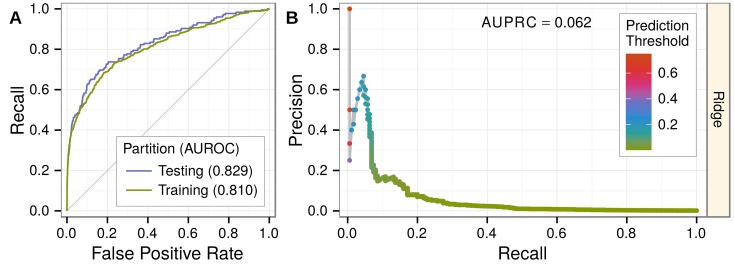
Fig 3. Predicting associations withheld for testing.
Performance was evaluated on 25% of gene-disease pairs withheld for testing. A) Testing and training ROC curves. At top prediction thresholds, associated gene-disease pairs are recalled at a much higher rate than unassociated pairs are incorrectly classified as positives. The testing area under the curve (AUROC) is slightly greater than the training AUROC, demonstrating the method’s lack of overfitting. Performance greatly exceeds random denoted by gray line. B) The precision-recall curve showing performance in the context of the low prevalence of associated gene-disease pairs (0.13%). Nevertheless, at top prediction thresholds, a high percentage of pairs classified as positives are truly associated. Prediction thresholds, shown as points and colored by value, align with the observed precision at that threshold.

