
Figure 6.
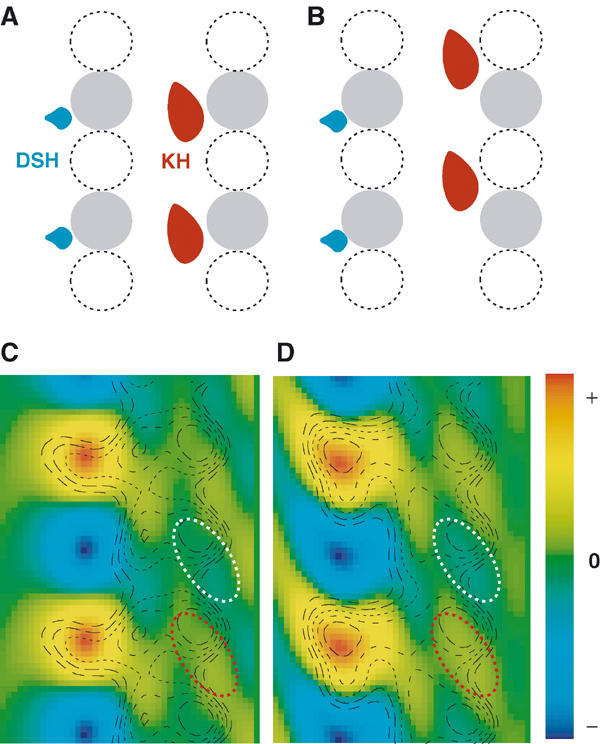
Relative positions of DSH, KH and tubulin dimers. (A, B) Two possible arrangements of the relative positions of DSH, KH and the tubulin dimer. One tubulin (e.g. β-tubulin) is shown in gray, while the other (e.g. α-tubulin) is shown with a dashed line. (C) DSH–microtubule complex: a section of the density map generated from the 80 Å layer line, shown as a color map. The radial projection map is overlaid as a contour plot to orient the density map. (D) KH–microtubule complex. White and red ellipses enclose lower and higher density stripes, respectively, in the microtubule.