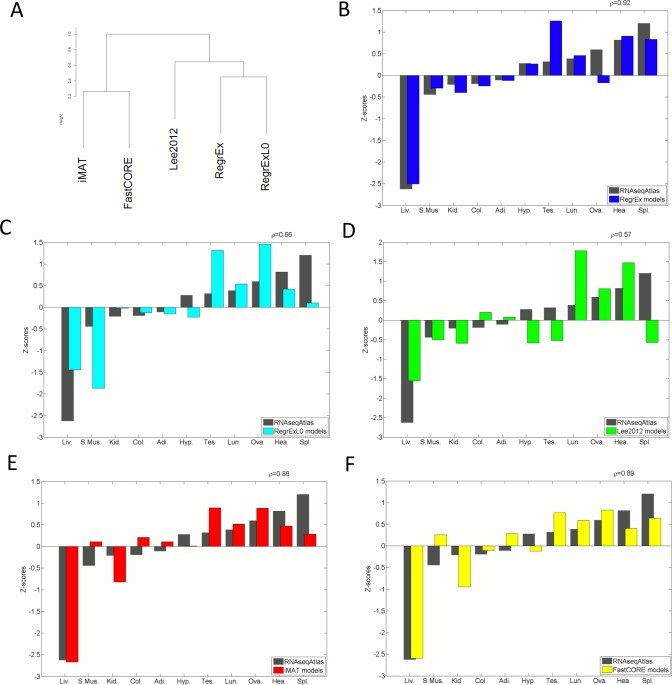
Fig 1. Dendrogram clustering the evaluated methods and comparison of data- and model-derived z-scores quantifying the differences between contexts.
(A) The dendrogram is obtained from the the Jaccard similarity that models have across the different methods. Two main clusters are formed, iMAT and FastCORE on one side, and Lee2012, RegrEx-λ0 and RegrEx on the other. In the second cluster, RegrEx and RegrEx-λ0 form a subcluster. (B-F) data- and model-derived z-scores are compared for RegrEx, RegrEx-λ0, Lee2012, iMAT and FastCORE, respectively. Correlation values between the two series (data and model) are shown in the right upper corner in each case. Adi.:Adipose, Col.:Colon, Hea.:Heart, Kid.:Kidney, Liv.:Liver, Lun.:Lung, Ova.:Ovary, S.Mus.:Skeletal Muscle, Spl.:Spleen, Tes.:Testes.

