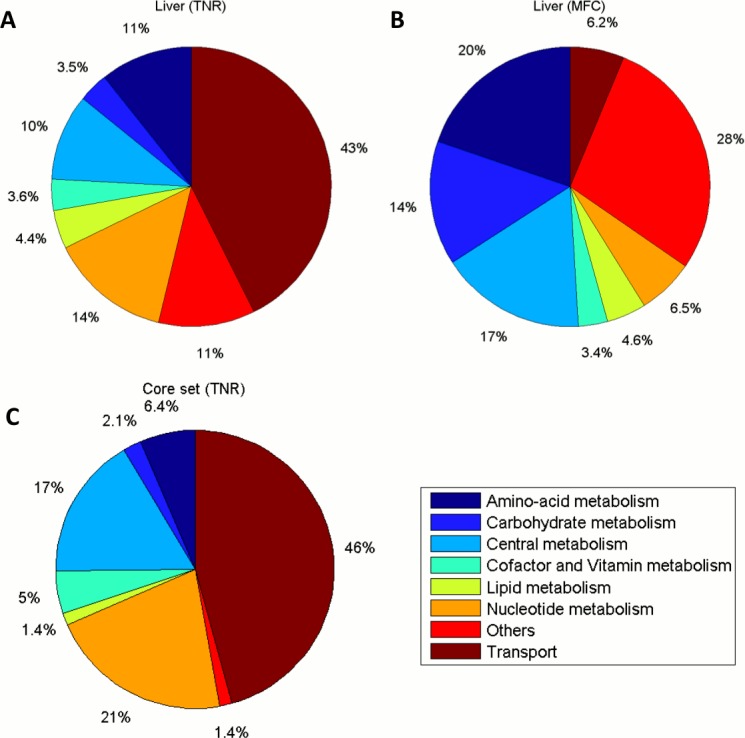
Fig 2. Pie charts displaying the core set of shared reactions for the 11 models extracted by RegrEx and a selected comparison of the metabolic categories presented in the liver model.

(A) Distribution of the total number of reactions (TNR) per metabolic category for the liver model (containing a total of 821 reactions across all categories). (B) Distribution of the mean flux capacity (MFC) values of each metabolic category in the liver model, as explained in the main text, noticeable differences arise with respect to the distribution depict in A. (C) Reaction content (TNR) for the core set of shared reactions divided per metabolic category, as explained in the main text, the three dominant categories are Transport, Central and Nucleotide metabolism. Metabolic category names are displayed in the color bar legend.
