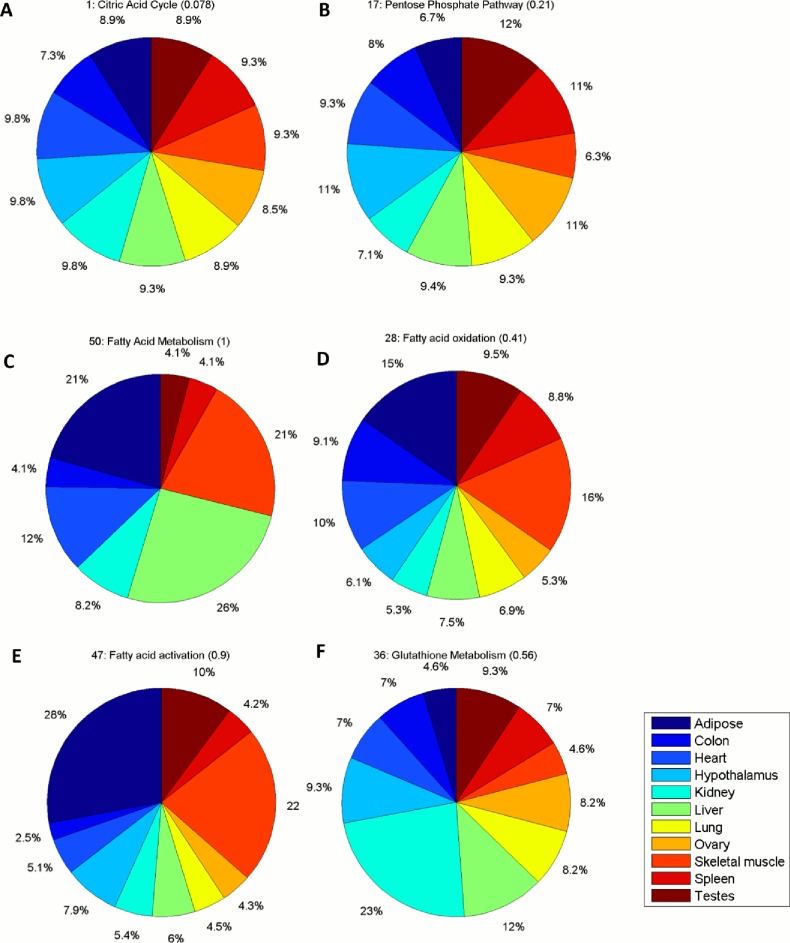
Fig 3. Illustration of selected Recon 1 subsystems displayed in a Pie chart form, depicting the distribution of mean flux capacity (MFC) values across contexts.
Panels A-B correspond to the two extreme metabolic subsystems, in terms of CV, in Central metabolism. The citric acid cycle (A) shows the lowest CV value (both in Central metabolism and within the entirety of Recon 1 subsystems). The pentose phosphate pathway (B) shows the greatest CV value in Central metabolism. (C-E) the distribution of MFC values is shown for fatty acid metabolism (C) which is predominantly represented in liver, adipose tissue and skeletal muscle, fatty acid oxidation (D) and fatty acid activation (E) both subsystems predominant in adipose tissue and skeletal muscle. (F) The MFC distribution across contexts is depicted for gluthatione metabolism. Kidney is the context where this subsystem gets a highest MFC value, constituting a 23% of the total MFC value across contexts. See main text for details. In all cases, the first number preceding the name of the subsystem corresponds to its position in the ranking generated by the CV values, which are shown in round brackets here. Context names are displayed in the color bar legend.

