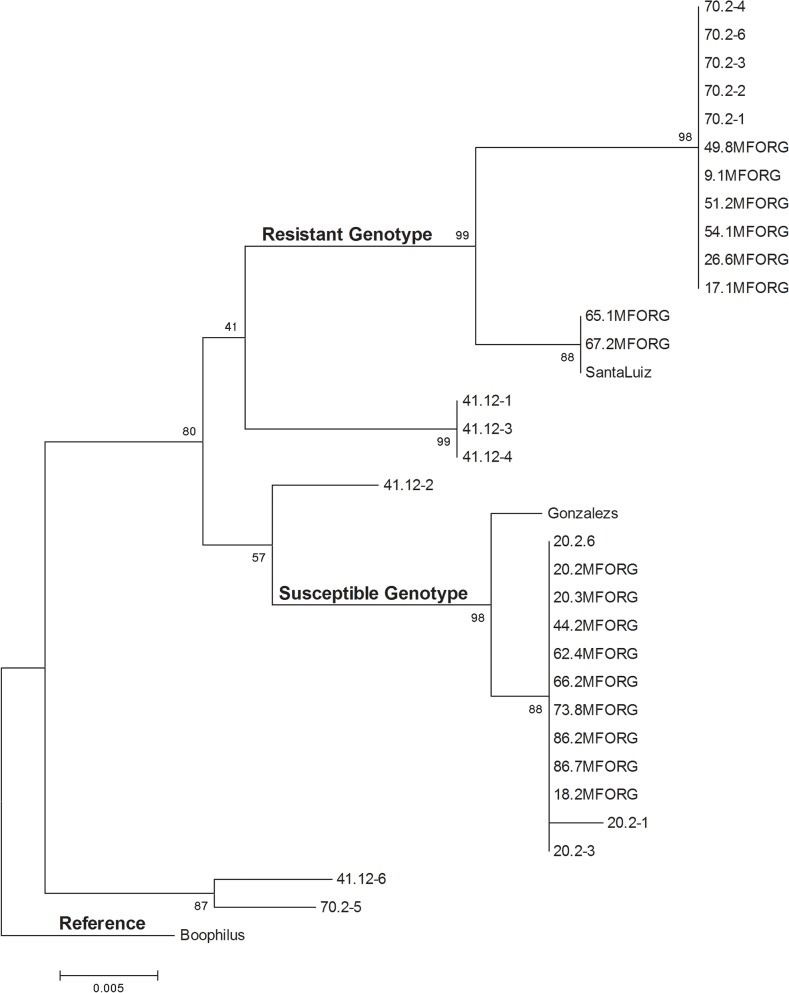
Fig 3. Lineages based on OCT/Tyr receptor sequences from R. microplus ticks in South Africa.
The evolutionary history was inferred using the Neighbor-Joining method [56]. The optimal tree with the sum of branch length = 0.10881934 is shown. The percentage of replicate trees in which the associated taxa clustered together in the bootstrap test (500 replicates) are shown next to the branches [59]. The tree is drawn to scale, with branch lengths in the same units as those of the evolutionary distances used to infer the phylogenetic tree. The evolutionary distances were computed using the Maximum Composite Likelihood method [60] and are in the units of the number of base substitutions per site. The analysis involved 34 nucleotide sequences. All positions containing gaps and missing data were eliminated. There were a total of 364 positions in the final dataset. Evolutionary analyses were conducted in MEGA5 [55]. GenBank accession numbers for each sample is displayed in S1 Table.

