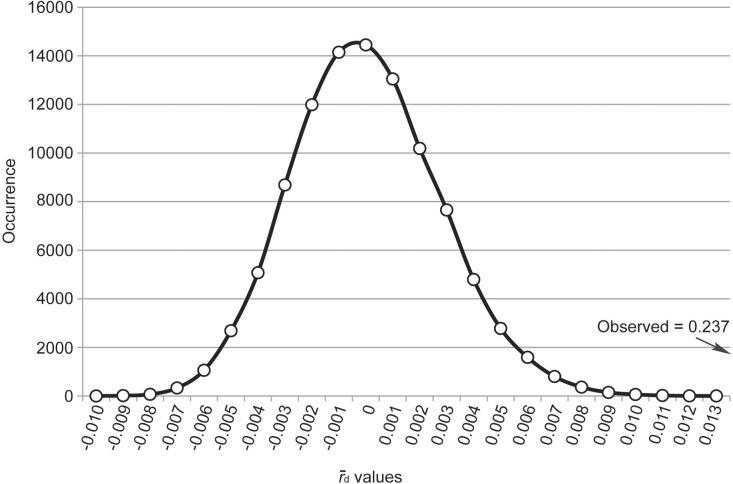
Fig 5. The density distribution for the OCT/Tyr receptor.
The values are placed on the x-axis while the relative occurrence of each of these values is displayed on the y-axis. The observed value falls outside of the distribution range generated by the randomized data set indicating that there is gametic disequilibrium.

