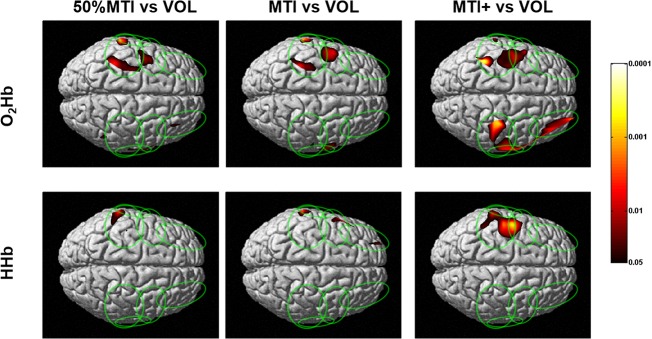
Fig 4. Group mean (n = 9) cortical oxygenated (O2Hb) and deoxygenated (HHb) hemoglobin contrast maps between the voluntary (VOL) and NMES conditions at percentages of the individual maximal tolerated current intensity (MTI).

The vertical colored scale indicates the significance level based on the uncorrected p-values (p<0.05-p<0.0001).
