
Fig 3. Histamine increased blood flow volume.
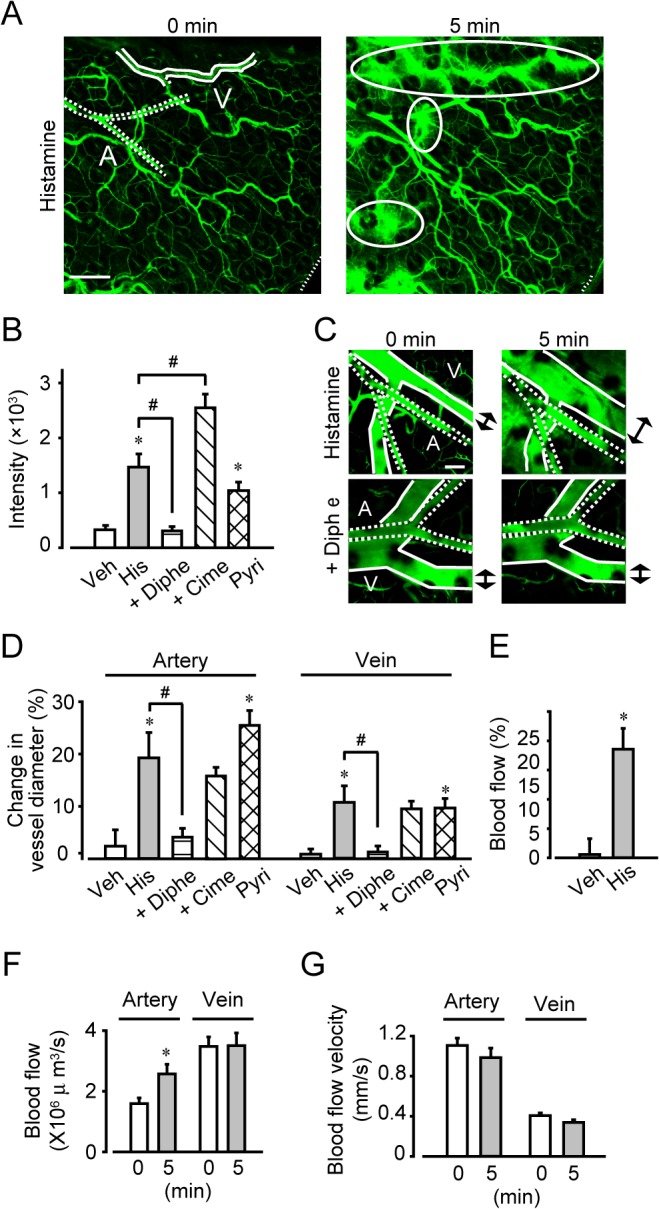
(A) Typical images of the proximal vessel region before and 5 min after histamine treatment (magnification, ×100). Bar, 200 μm. Solid lines indicate vein. Dotted lines indicate artery. Ovoid circles indicate the FITC-dextran leakage. (B) Quantification of the FITC-dextran leakage after histamine application (n = 6–12). (C) Typical images of histamine-induced relaxation (magnification, ×200). Bar, 100 μm. A, artery; V, vein. (D) Quantification of the change in vessel diameter (n = 6–12). (E) Measurement of blood flow 5 min after histamine application using laser doppler velocimetry (n = 8). Measurement of blood flow (F) and blood flow velocity (G) before and 5 min after histamine application using in vivo microscopy (n = 15). *P < 0.05, compared with vehicle. #P < 0.05, compared with histamine. Data are presented as mean ± SEM.