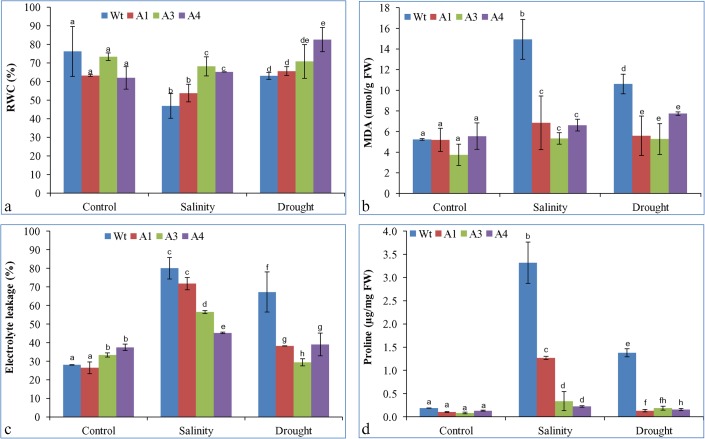
Fig 8. Physiological analysis of transgenic lines.
Estimation of (a) RWC, (b) lipid peroxidation, (c) electrolyte leakage and (d) proline content from leaves of Wt plants and transgenic lines under control, salinity (250 mM NaCl) and drought stress conditions. Bars represent means ± SD and values with similar letter are non-significant at P<0.05.

