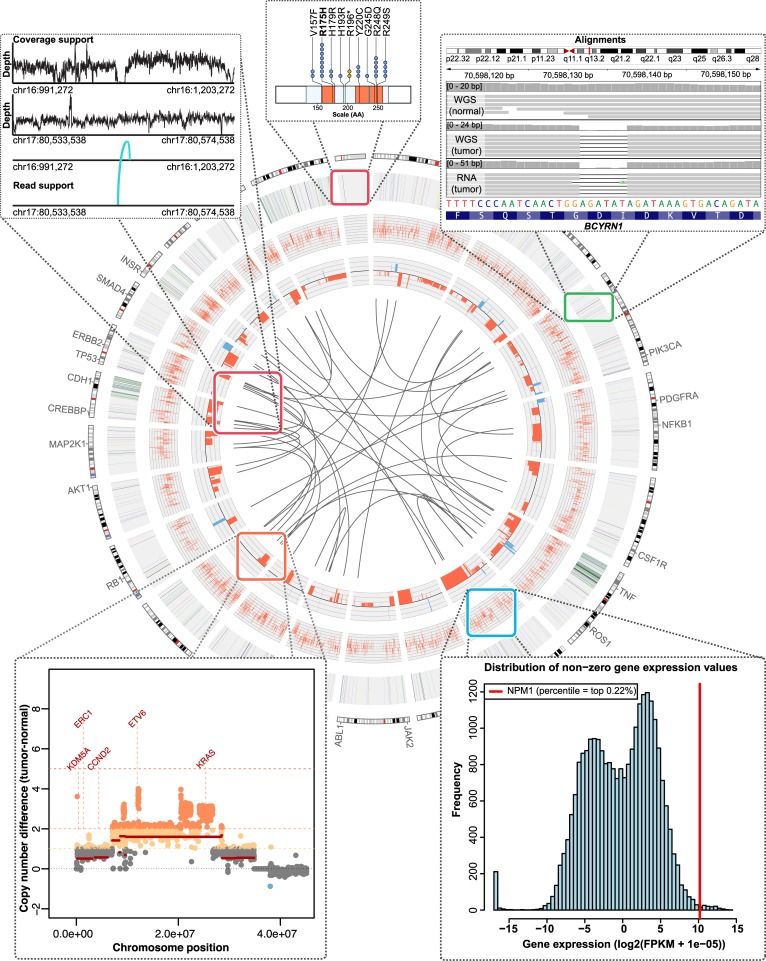
Fig 5. Circos plot of HCC1395 tumor/normal comparison.
Circos is a popular tool for summarizing genomic events in a tumor genome. This is just one of many automatically generated visualizations made possible by the GMS. In this example, the WGS, exome and RNA-seq data for HCC1395 are displayed in several tracks along with additional visualizations illustrating individual events. Moving inwards, SNVs and Indels are plotted on the outermost track, then highly expressed genes, CNVs, and finally chromosomal translocations at the center. For events predicted to affect protein coding genes, additional plots are auto-generated to display the mutation position relative to protein domains and previously reported mutations from the Cosmic database, as illustrated in the topmost plot. Moving clockwise, a screenshot of IGV demonstrates one of the somatic deletions identified. IGV XML sessions are automatically generated to allow rapid manual review of all predicted events. Next, a histogram illustrates the expression of a single highly expressed gene relative to the distribution of expression for all genes. Then, a CNV plot is shown for an amplified portion of one chromosome. Finally, the coverage and supporting reads for a chromosomal translocation are depicted.

