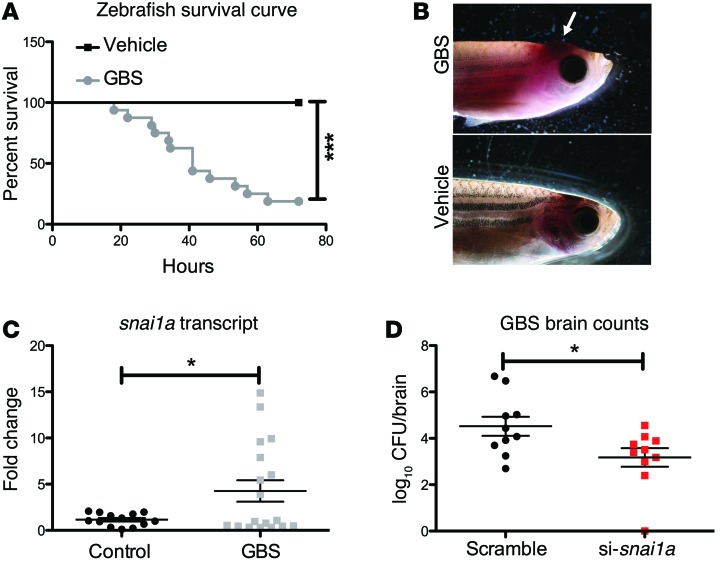
Figure 7. Contribution of Snail1 to GBS-BBB penetration in vivo.
Kaplan-Meier survival curve for zebrafish (n = 9/group) infected with GBS (A). Representative images of GBS-infected zebrafish showing cerebral swelling and edema compared with noninfected controls (B). GBS infection increased snai1a transcript levels in brain homogenates of zebrafish following GBS infection (n = 19) compared with those in noninfected zebrafish (n = 12) (C). Knockdown of snai1a using siRNA duplexes (n = 10/treatment group) did not change GBS bloodstream survival, but attenuated bacterial penetration into the brain (D). Representative data from 1 of 2 independent experiments are shown. Student’s t and log-rank tests were used to determine significance. *P < 0.05; ***P < 0.001.

