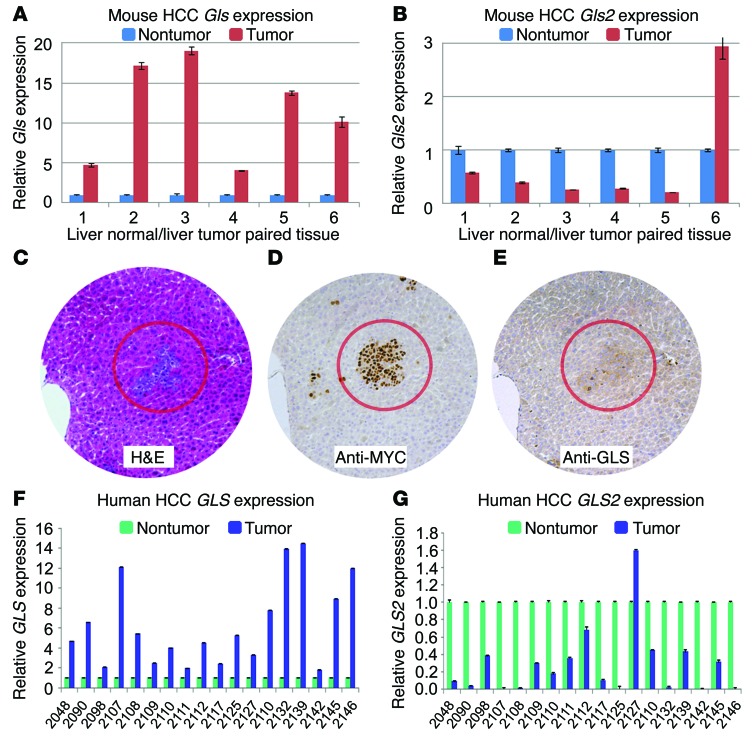
Figure 1. Increased GLS and decreased GLS2 expression in mouse HCC model and human HCC samples.
(A) Gls mRNA levels determined by qPCR in LAP/MYC tumors compared with surrounding liver tissue (numbers at the bottom correspond to different mice). The test was done in triplicate; results represent mean ± SEM of technical triplicates. (B) Gls2 mRNA levels in LAP/MYC tumors compared with surrounding liver tissue. (C–E) Histology of consecutive sections of LAP/MYC tumors. H&E stain (C) shows early tumor formation in 3-week-old LAP/MYC mice with corresponding elevation of MYC (D) and GLS staining (E). Original magnification, ×10. (F) GLS mRNA levels determined by qPCR in human HCC tumors compared with surrounding nontumor tissue (numbers at the bottom represents different patients). (G) GLS2 mRNA levels in human HCC tumors compared with surrounding nontumor tissue. Test was done in triplicate; results represent mean ± SD. For F and G, numbers represent individual patients. Student’s t test was used.

