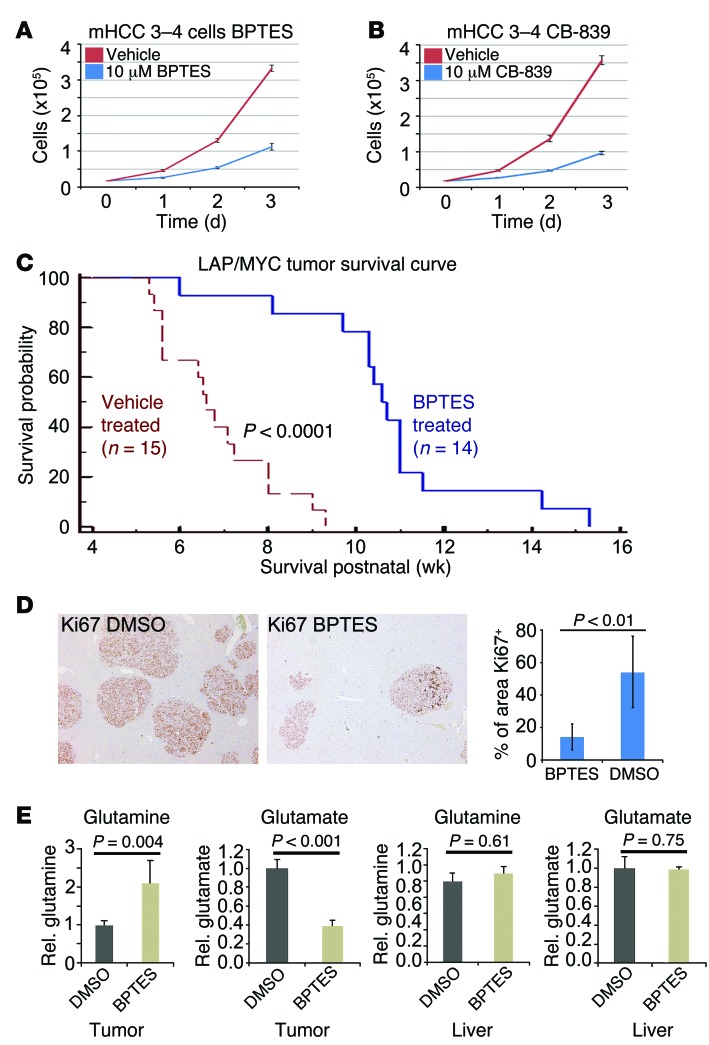
Figure 3. GLS inhibition prolongs survival in mouse HCC model.
(A) Effect of 10 μM BPTES on the in vitro growth of mHCC 3–4 cells derived from LAP/MYC tumors. n = 3. P < 0.001. (B) Effect of 10 μM GLS inhibitor CB-839 on the growth of mHCC 3–4 cells in vitro. n = 3. P < 0.001. (C) Kaplan-Meier plot of survival of BPTES-treated (n = 14) versus vehicle DMSO–treated LAP/MYC mice (n = 15). (D) Micrographs of representative fields of Ki-67–stained liver tumors from BPTES (n = 6) or vehicle-treated (n = 6) LAP/MYC mice. The far right graph depicts the quantification of area that is Ki-67 positive. Original magnification, ×5. (E) Relative glutamine and glutamate levels in tumors or normal livers from mice treated with BPTES or DMSO were measured (n = 5 each). Values are shown as mean ± SD. Student’s t test was used.

