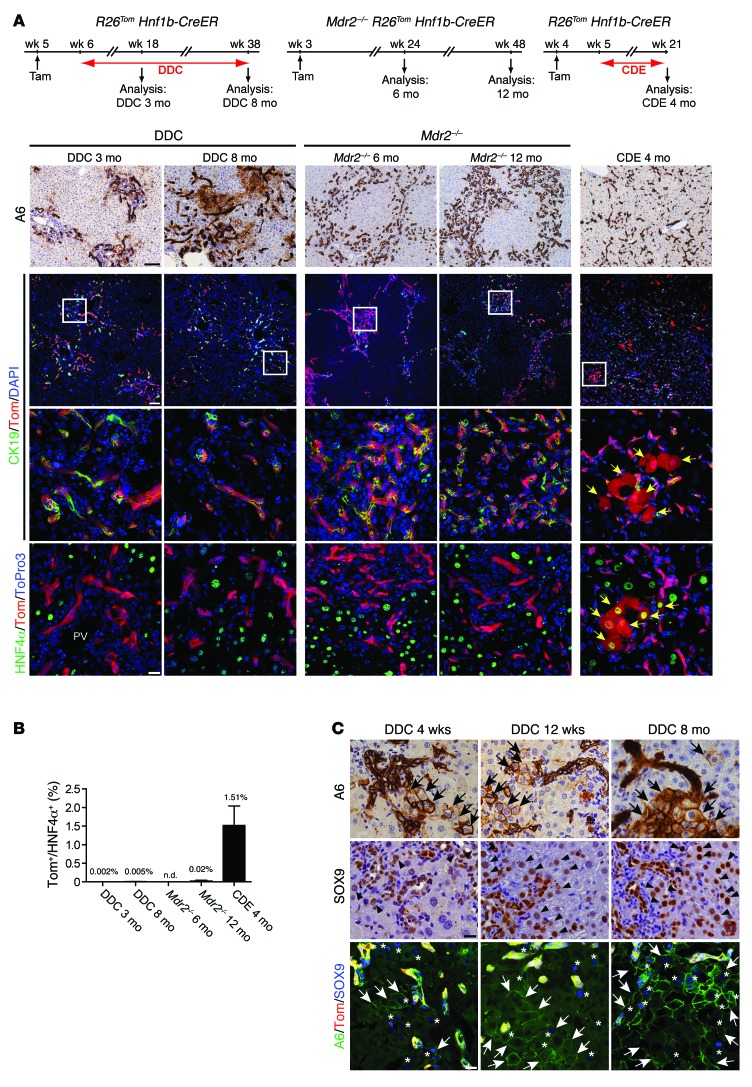
Figure 3. Minimal contribution of DRCs to hepatocyte neogenesis after long-term liver injury.
(A) We traced the fate of lineage-labeled DRs in R26Tom Hnf1b-CreER animals after prolonged DDC diet (up to 8 months) or CDE diet (4 months) as well as lineage-labeled DRs in Mdr2–/– R26Tom Hnf1b-CreER animals (up to 12 months). Despite dramatic expansions of A6+ (IHC) or tdTom+/CK19+ (IF) DRs in all long-term injury models, only mice fed CDE diet for 4 months displayed a small fraction of HNF4α+ hepatocytes coexpressing tdTom (IF, yellow arrows). Representative pictures are shown of n = 4 to 6 animals analyzed per group. (B) Proportion of HNF4α+ hepatocytes that coexpress tdTom. tdTom+/HNF4α+ hepatocytes (mean value ± SEM) were quantified from n = 4 to 6 animals per group. (C) In the DDC model, IHC analysis for A6 and SOX9 shows hepatocytes and cells of intermediate morphology that express biliary markers (arrows and arrowheads in IHC panels), with increasing time of injury surrounding typical A6+ DRs. Co-IF analysis for tdTom, A6, and SOX9 revealed no coexpression of tdTom in A6+ or SOX9+ hepatobiliary cells (arrows and asterisks), indicating their hepatocyte origin (for quantification, refer to Supplemental Figure 5). Scale bar: 100 μm (top 2 rows, A); 20 μm (bottom 2 rows, A, and C).

