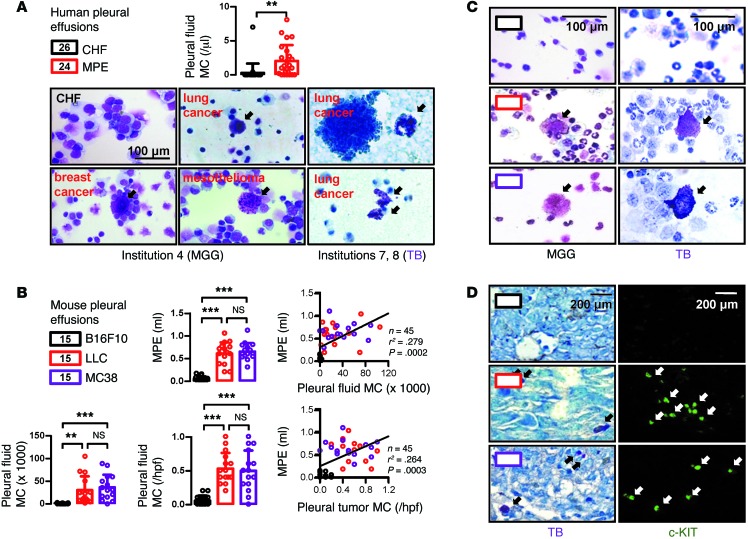
Figure 1. MCs in human and murine MPEs.
(A) Pleural MCs from patients with MPEs (n = 24) or CHF (n = 26) from 2 Hellenic hospitals. (B) MPEs and MCs of C57BL/6 mice 14 days after pleural delivery of 1.5 × 10⁵ syngeneic tumor cells (n = 15 mice per tumor cell type). Right: correlation between MPE and tumor-MC abundance and MPE volume, with linear regression line, sample size (n), probability value (P), and squared Pearson correlation coefficient (r2). Hpf, high-power field. (C and D) Representative microphotographs of pleural fluid (C) and tumor (D) MCs from mice from B. Data presented as data points, mean ± SD. Numbers in boxes indicate sample size. Arrows indicate MCs. NS, P > 0.05; **P < 0.01; and ***P < 0.001, by 2-tailed Student’s t test (A) or 1-way ANOVA with Bonferroni post hoc tests (B).

