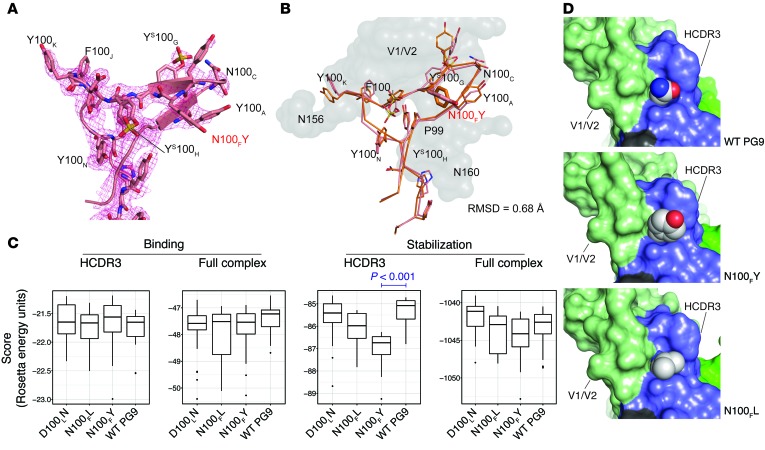
Figure 3. PG9_N100FY Fab crystal structure and Rosetta models.
(A) Unliganded PG9_N100FY HCDR3 crystal structure. 2Fo – Fc electron density is shown as a mesh grid contoured at 1σ. Electron density shows tyrosine sulfation at YS100G and YS100H but not at N100FY. N100FY stacks against P99 and Y100A, thereby providing increased stability. (B) Unliganded crystal structure aligned with Rosetta complexed model has an all-atom RMSD of 0.68 Å. Rosetta top-scoring model modeled from PDB ID: 3U4E complex is shown in orange. V1/V2 antigen from the model is shown as a gray surface. Crystal structure of the HCDR3 loop of PG9_N100FY is shown in pink. The N100FY mutation, highlighted in red, adopts the same conformation in the crystal structure as in the Rosetta model. (C) Rosetta scores for HCDR3 binding, total binding, HCDR3 stabilization, or total stabilization (scores shown as REU for 1000 simulations ± STD). Only significant differences where the means were below that of WT PG9 are shown. All other comparisons were not significant with a confidence of 0.05 or the means were above that of WT PG9 using a Student’s 2-sided t test. (D) Models for WT PG9 and the top scoring variants N100FL and N100FY are shown in a sphere and surface representation. The atom types are colored for carbon (gray), oxygen (red), or nitrogen (blue). The V1/V2 epitope is indicated in green, the antibody HCDR3 loop in dark blue, the N160 complex glycan in dark green, and non-HCDR3 portions of the antibody heavy chain in black.

