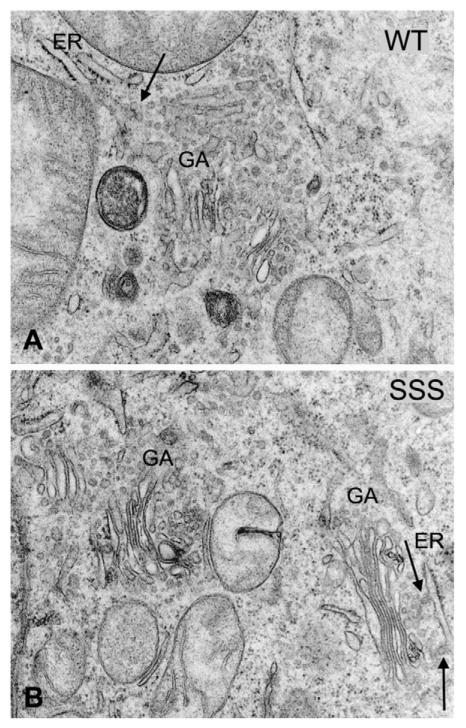
Fig. 2.
Ultrastructure of HEK293 cells expressing wild-type (WT) GAT1 (A) and GAT1-SSS (B). Cells grown on glass coverslips were fixed in 2.5% glutaraldehyde, pH 7.4, post-fixed in 1% veronal-acetate-buffered OsO4, dehydrated in a graded series of ethanol and embedded in Epon. The electron micrographs show parts of the paranuclear cytoplasm, in which cisternae of the ER, ER exit sites (arrows) and Golgi apparatus stacks (GA) are visible. Magnification was 33,000× (A,B).

