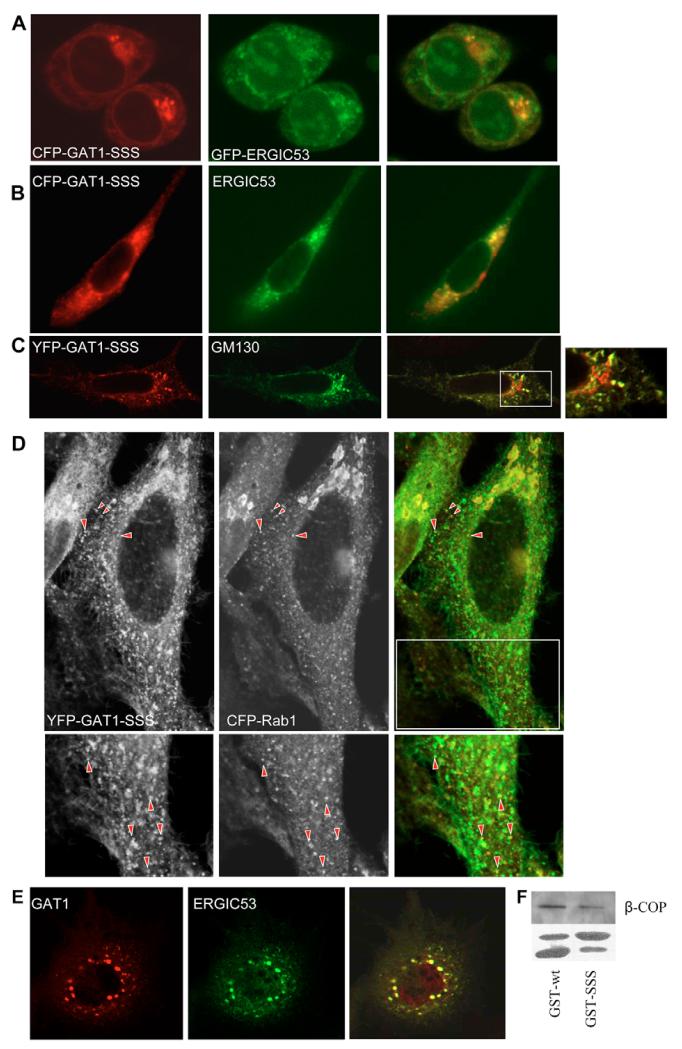
Fig. 5.
GAT1-SSS localizes to the ERGIC. (A) HEK293 cells co-expressing CFP-GAT1-SSS and GFP-ERGIC53 were incubated at 15°C for 2 hours. Cells were fixed and images were subsequently captured by confocal microscopy (Zeiss LSM 510). Overlays (right) were generated using the Zeiss LSM image browser. (B) LdlF cells were co-transfected with plasmids encoding CFP-tagged GAT1-SSS and GFP-tagged ERGIC53. Cells were maintained at 34°C for 20 hours. Thereafter, the temperature was shifted to 40°C for 5 hours; subsequently, the images were captured with a CCD camera, digitized and overlaid (right) using MetaMorph software. (C) HeLa cells were transfected with a plasmid encoding YFP-tagged GAT1-SSS. After 24 hours, cells were treated with BFA (5 μg/ml) for 10 minutes at 37°C. Afterwards, cells were fixed and GM130 was detected by immunofluorescence. Images were acquired using a confocal microscope (Leica SPE). The boxed area in the overlaid image is shown close-up on the right. (D) HeLa cells were co-transfected with plasmids encoding YFP-tagged GAT1-SSS and CFP-tagged RAB1. After 24 hours, cells were fixed. Images were acquired using a confocal microscope (Leica SP5). Raw images are displayed in grey to enhance visibility of the peripheral structures. Arrowheads highlight peripheral punctae showing colocalization. The lower panels show magnified views of the boxed region. (E) LdlF cells were co-transfected with plasmids encoding YFP-tagged wild-type GAT1 and myc-tagged ERGIC53. Cells were cultured at 34°C for 20 hours. Thereafter, the temperature was shifted to 40°C for 5 hours. Subsequently, cells were fixed and processed for immunofluorescence against the myc-epitope. (F) Cytosol from HEK293 cells (100 μg) was incubated with a fusion protein comprising GST and the GAT1 C-terminus (10 μg), either in its wild-type version (GST-wt) or that of mutated GAT1-SSS (GST-SSS). The GST-pull-down was performed as indicated in the Materials and Methods. The upper panel shows immunostaining for β-COP. In the lower panel, GST fusion proteins were visualized by staining with Ponceau red. The upper band represents the fusion protein of GST and C-terminus, whereas the lower band reflects proteolytic degradation and corresponds to the size of GST.

