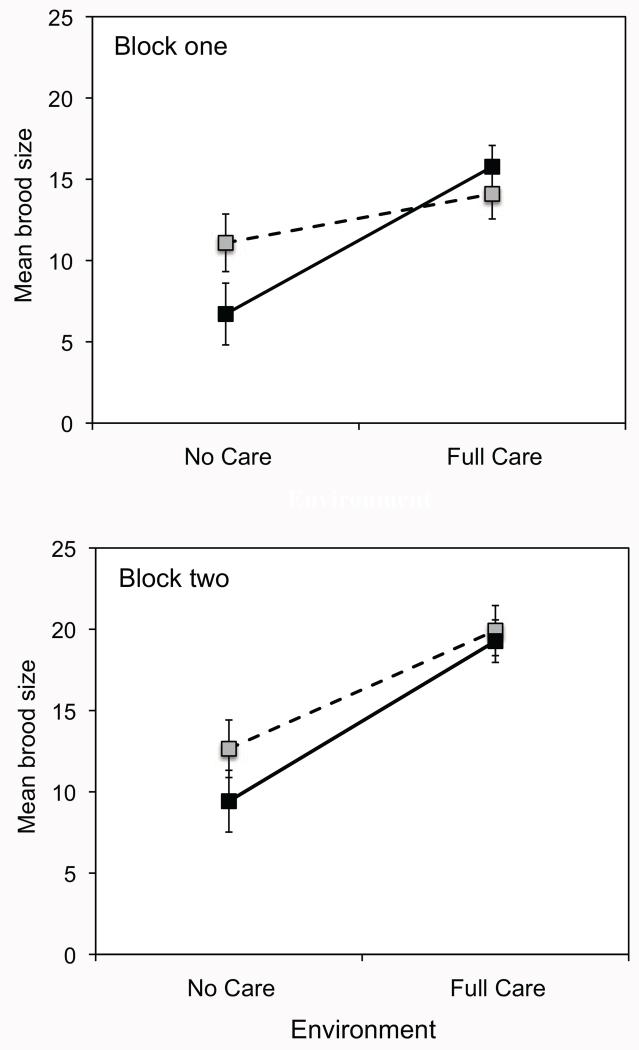
Figure 3.
Mean brood size (±1 SEM) of beetle pairs descended from No Care (gray squares, dashed lines) and Full Care (black squares, solid lines) populations in the absence or presence of posthatching care (X-axis). Data in the top panel are from block 1, and data in the bottom panel are from block 2.

