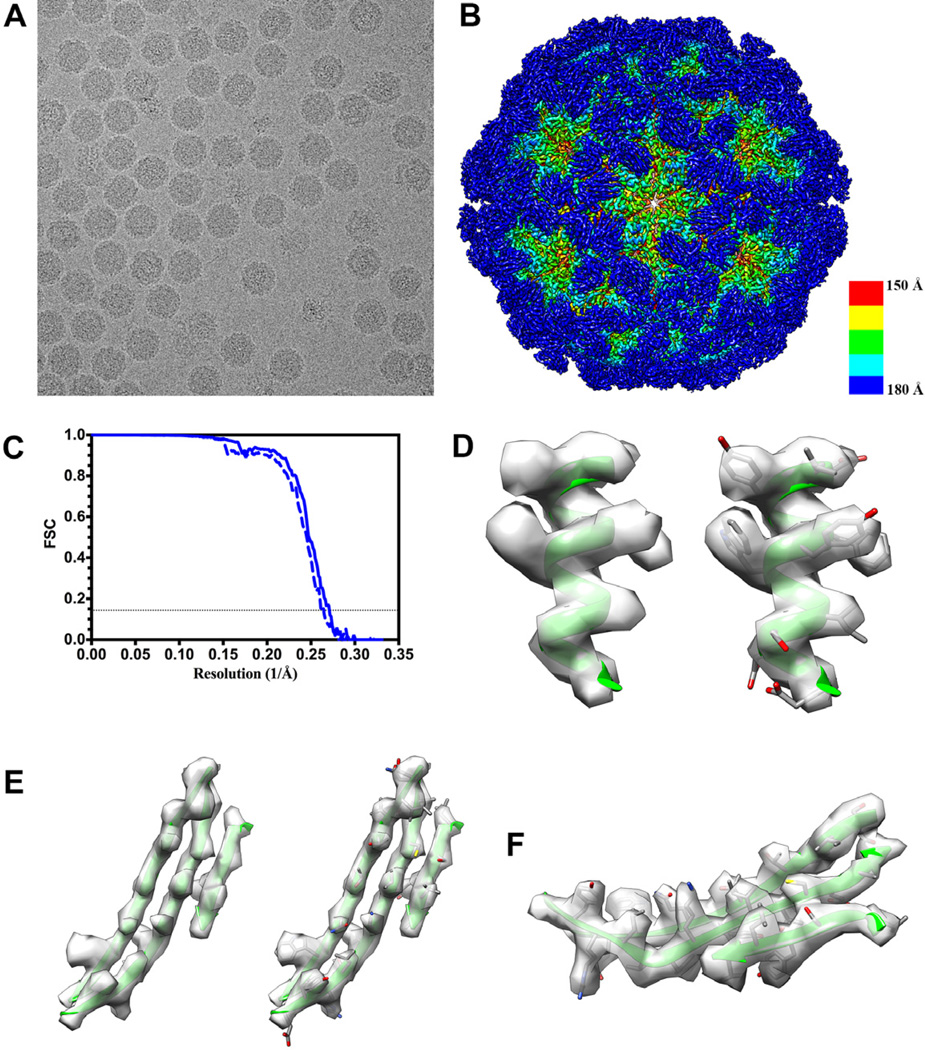
Figure 1. NωV reconstruction at 3.7 Å resolution.
(A) A micrograph of ice-embedded NωV virions after movie frame alignment (defocus: 1.5 µm). (B) NωV reconstruction colored by radius. The color key is indicated at the bottom right of the map. (C) Gold-standard Fourier shell correlation curves indicate a resolution of 3.8 Å before (dashed line) and 3.7 Å after (solid line) accounting for beam-induced motion rotations and translations for each particle, respectively. (D) An α-helical segment from one NωV subunit is shown in ribbon representation, without (left) and with (right) side chain atoms, along with the corresponding region of the reconstruction. Most side chains are visible. (E) A β-sheet segment from one NωV subunit is shown in ribbon representation, without (left) and with (right) side chain atoms, along with the corresponding region of the reconstruction. (F) Lateral view of the β-sheet depicted in (D) showing that most side chains are resolved.

