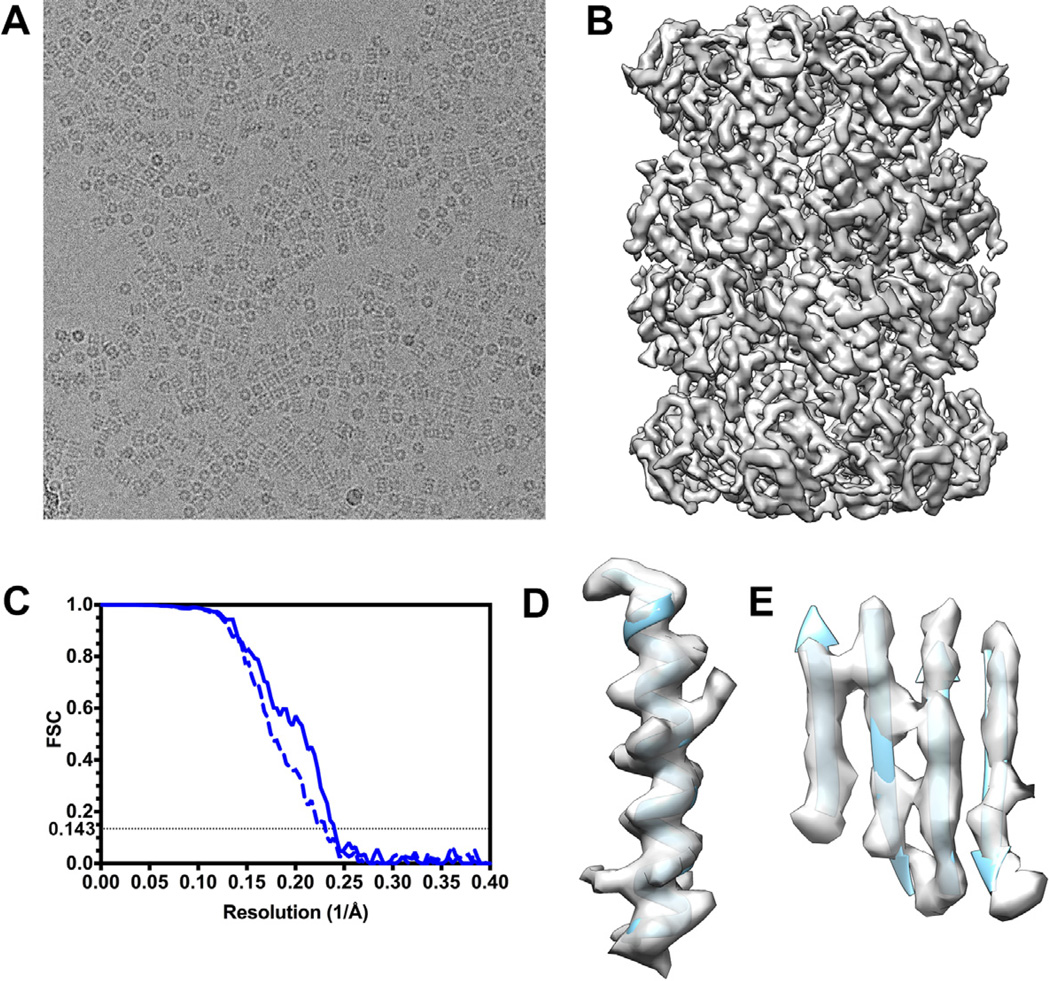
Figure 2. T20S proteasome reconstruction at 4.2 Å resolution.
(A) A micrograph of ice-embedded T20S after movie frame alignment (defocus: 2.1 µm). (B) T20S reconstruction. (C) Gold-standard Fourier shell correlation curves indicate a resolution of 4.36 Å before (dashed line) and 4.18 Å after (solid line) accounting for beam-induced translations for each particle, respectively. (C) An α-helical segment from one β subunit is shown in ribbon representation with the corresponding region of the reconstruction. Bulky side chains are visible. (D) A β-sheet segment from one β subunit is depicted in ribbon representation with the corresponding region of the reconstruction showing that individual β-strands are resolved.

