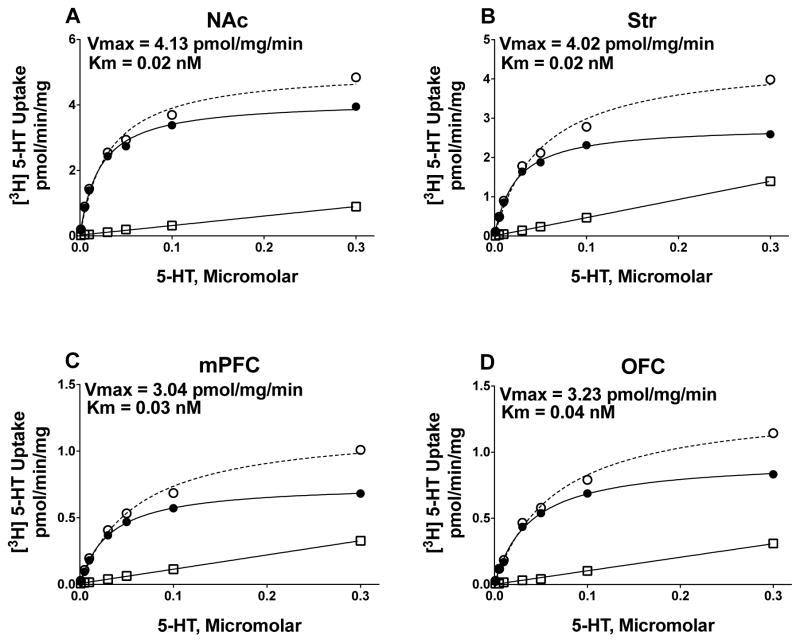
Figure 3.
Saturation curves for [3H]5-HT uptake at SERT in NAc, Str, mPFC, and OFC synaptosomal preparations from a representative individual rat. Nonspecific [3H]5-HT uptake was determined in the presence of 10 μM fluoxetine. Specific uptake (closed circles) was obtained by subtracting nonspecific uptake (open squares) from total uptake (open cirlces). Vmax represents the maximal velocity of [3H]5-HT uptake, and Km represents affinity of 5-HT for SERT.

