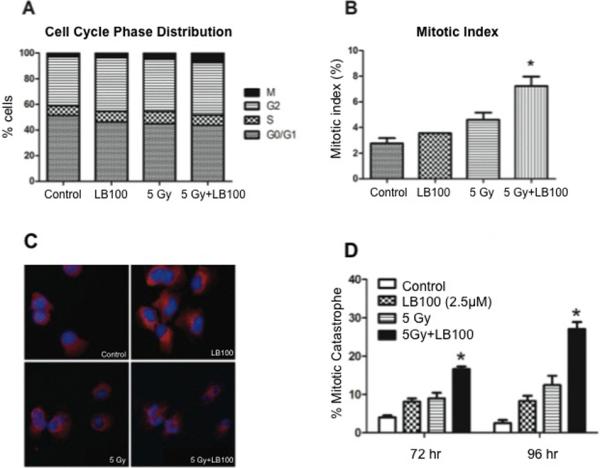
Figure 3. LB100 and radiation increase mitotic index and induce mitotic catastrophe.

(A) The percentage of cells in G0/G1, S, G2 and M phase of the cell cycle are depicted before and at 24 hours after radiation (5 Gy), with and without pre-exposure (for 4 hours) to LB100 treatment (2.5 μM). There was no difference in distribution of cells in G0/G1, S, or G2, but an increased number of cells in M phase (B) was seen after radiation and LB100 treatment. (C) U251 cells growing in chamber slides were exposed to LB100 (2.5 μM) for 4 hours, radiated (5 Gy), and after radiation were subjected to immunocytochemical analysis of mitotic catastrophe. Nuclear fragmentation (defined as the presence of two or more distinct lobes within a single cell) was evaluated in at least 150 cells per treatment per experiment. (D) Quantitative assessment of percentage of cells in mitotic catastrophe is shown. *, P < 0.05 (comparing cells in the combination group compared to either drug or radiation alone groups at the same time point).
