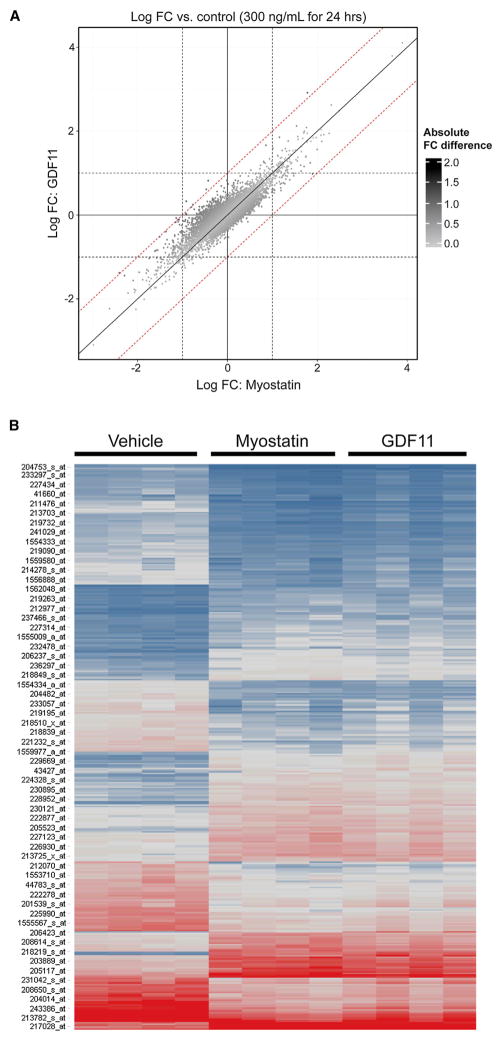
Figure 3. Microarray Analysis of hSkMDCs Treated with GDF11 or Myostatin Demonstrate that GDF11 and Myostatin Induce Almost Identical Expression Changes.
(A) The log fold-change (FC) versus control samples for samples (n = 4 biological replicates per group) stimulated for 24 hr with 300 ng/ml myostatin or GDF11 (x and y axes, respectively). Data points are colored by absolute FC difference, with darker points representing larger differences. Reference lines are included for log FC differences of 1/−1 (dashed) and 0 (solid).
(B) Gene expression was generated for hSkMDCs treated with GDF11 or myostatin. There were 243 genes (356 probe sets) regulated by either GDF11 or MSTN. Intensities are shown for vehicle and the two treatments (GDF11 and myostatin; 24 hr at 300 ng/ml). Blue, low expression; red, high expression; gray, median expression. Genes are regulated similarly by GDF11 and MSTN.

