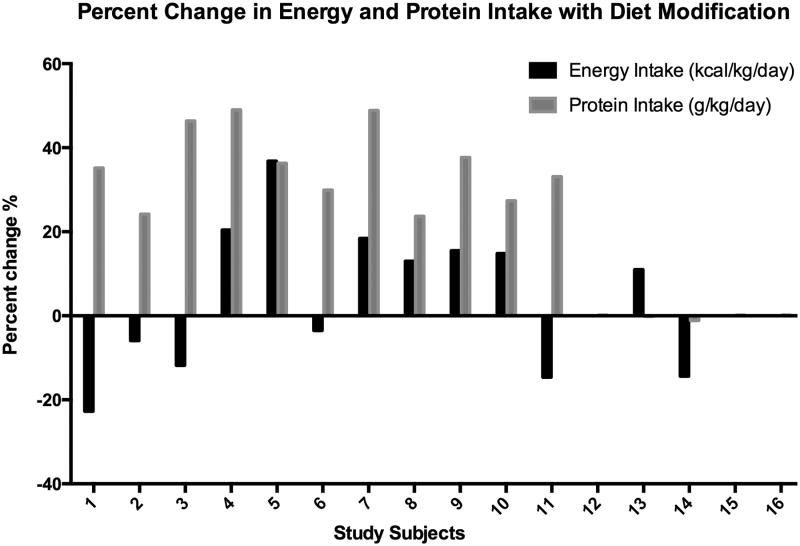
FIGURE 3.
Individual subject percent change in energy and protein with diet modification. Black bars represent a positive or negative change in energy intake. Gray bars represent a positive or negative change in protein intake. All 16 subjects completed the study. No bars represents no change in energy or protein intake.

